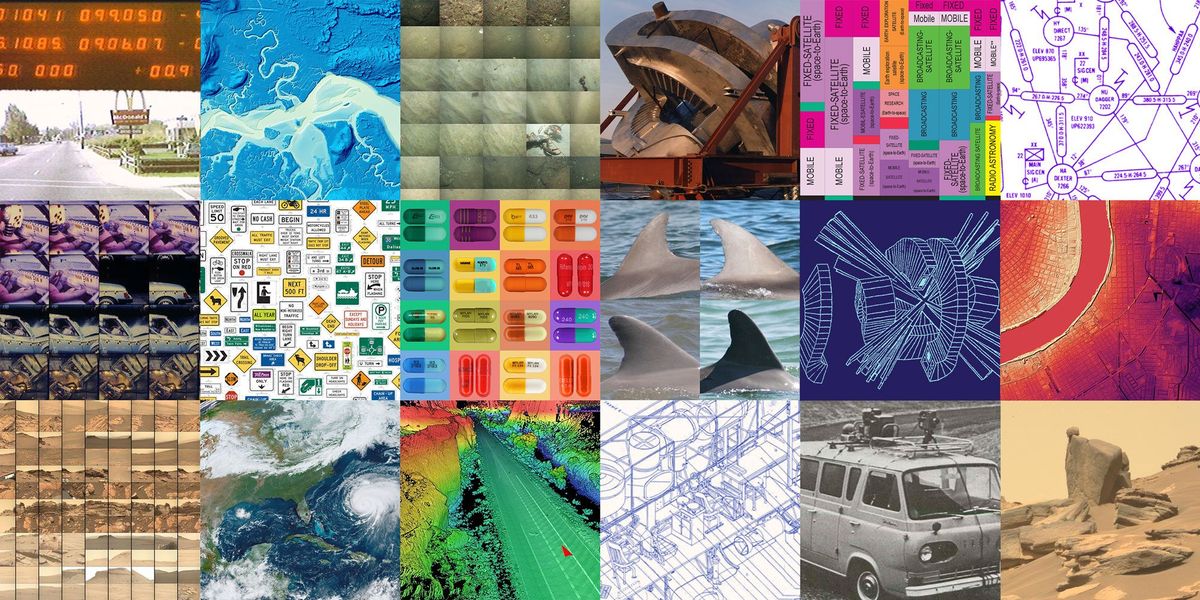
A curated selection of visually interesting datasets collected by local, state and federal government agencies. By @jonkeegan
Information is Beautiful
Distilling the world's data, information & knowledge into beautiful infographics & visualizations

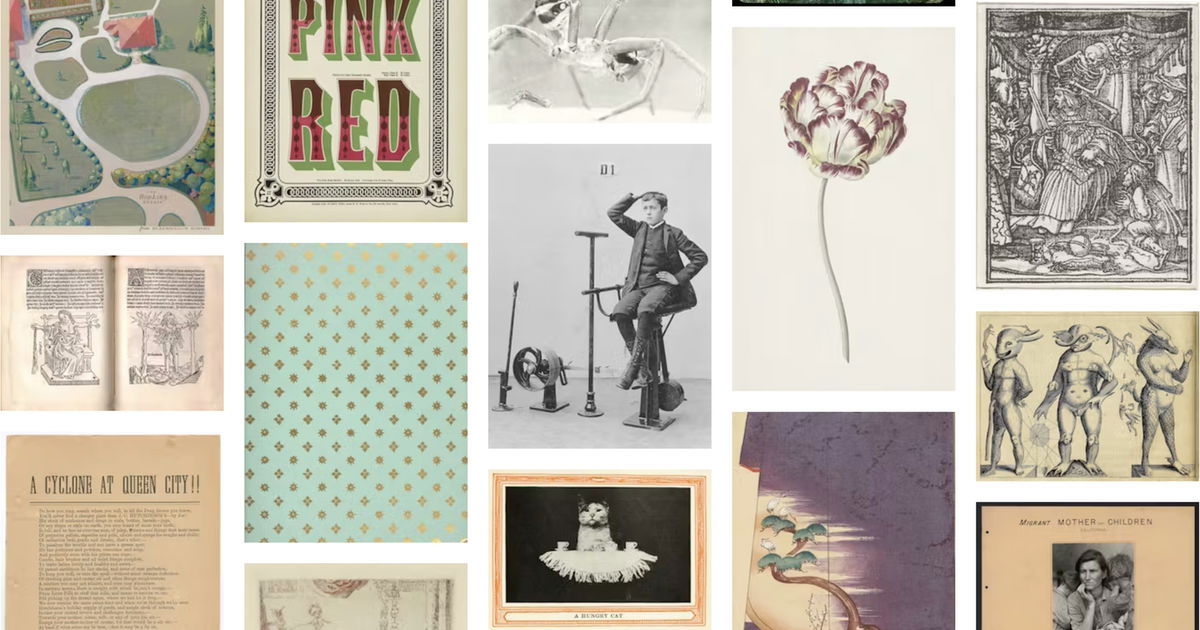
Public Domain Image Archive
Explore our hand-picked collection of out-of-copyright works, free for all to browse, download, and reuse. This is a living database with new images added every week.
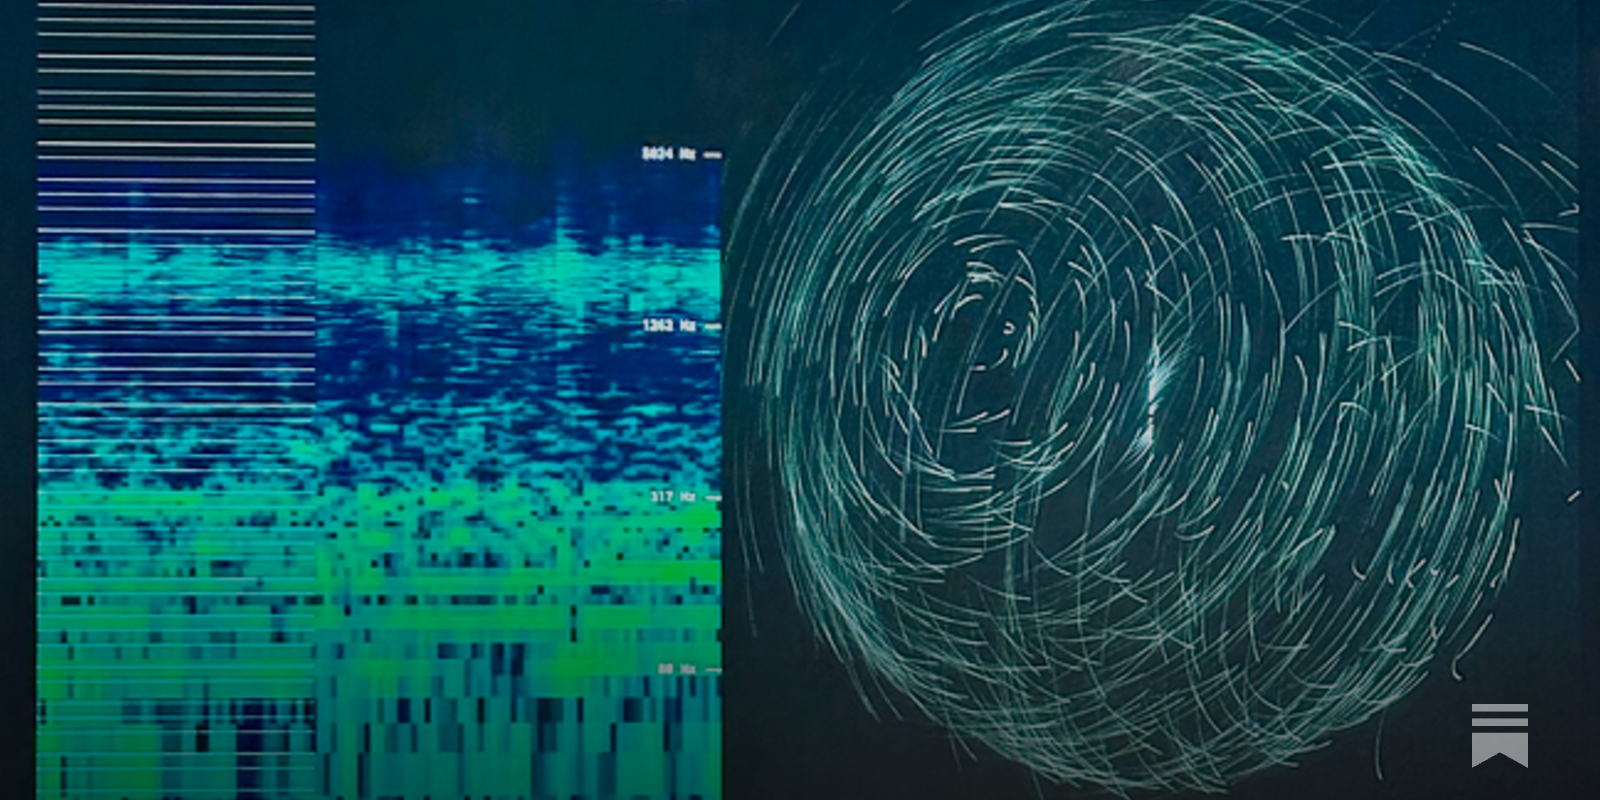
On power, aesthetics, materiality and change in data visualization
Notes from the Information+ Conference at MIT/Northeastern University, Boston.

Democratizing Data
Democratizing Data builds a community-driven data ecosystem by identifying how datasets are used and reducing barriers to accessing high-quality public data. The initiative enhances the discoverability, usability, and relevance of data for researchers, policymakers, and stakeholder communities. A suite of tools and strategic partnerships supports this work by connecting users to the data, insights, and networks needed to inform decisions and generate impact.

Cosmograph: Beautiful Visualization and Analytics | Cosmograph
Beautiful Visualization and Analytics

Search Free images, pictures and photos
Free photobank Page 1 from 2023 in HD quality. We still have more than 100,000 free photos and more than 200,000 pictures with effects, as well as backgrounds, textures, wallpaper, cards, graphics and backdrops to a variety of themes available for commercial use!
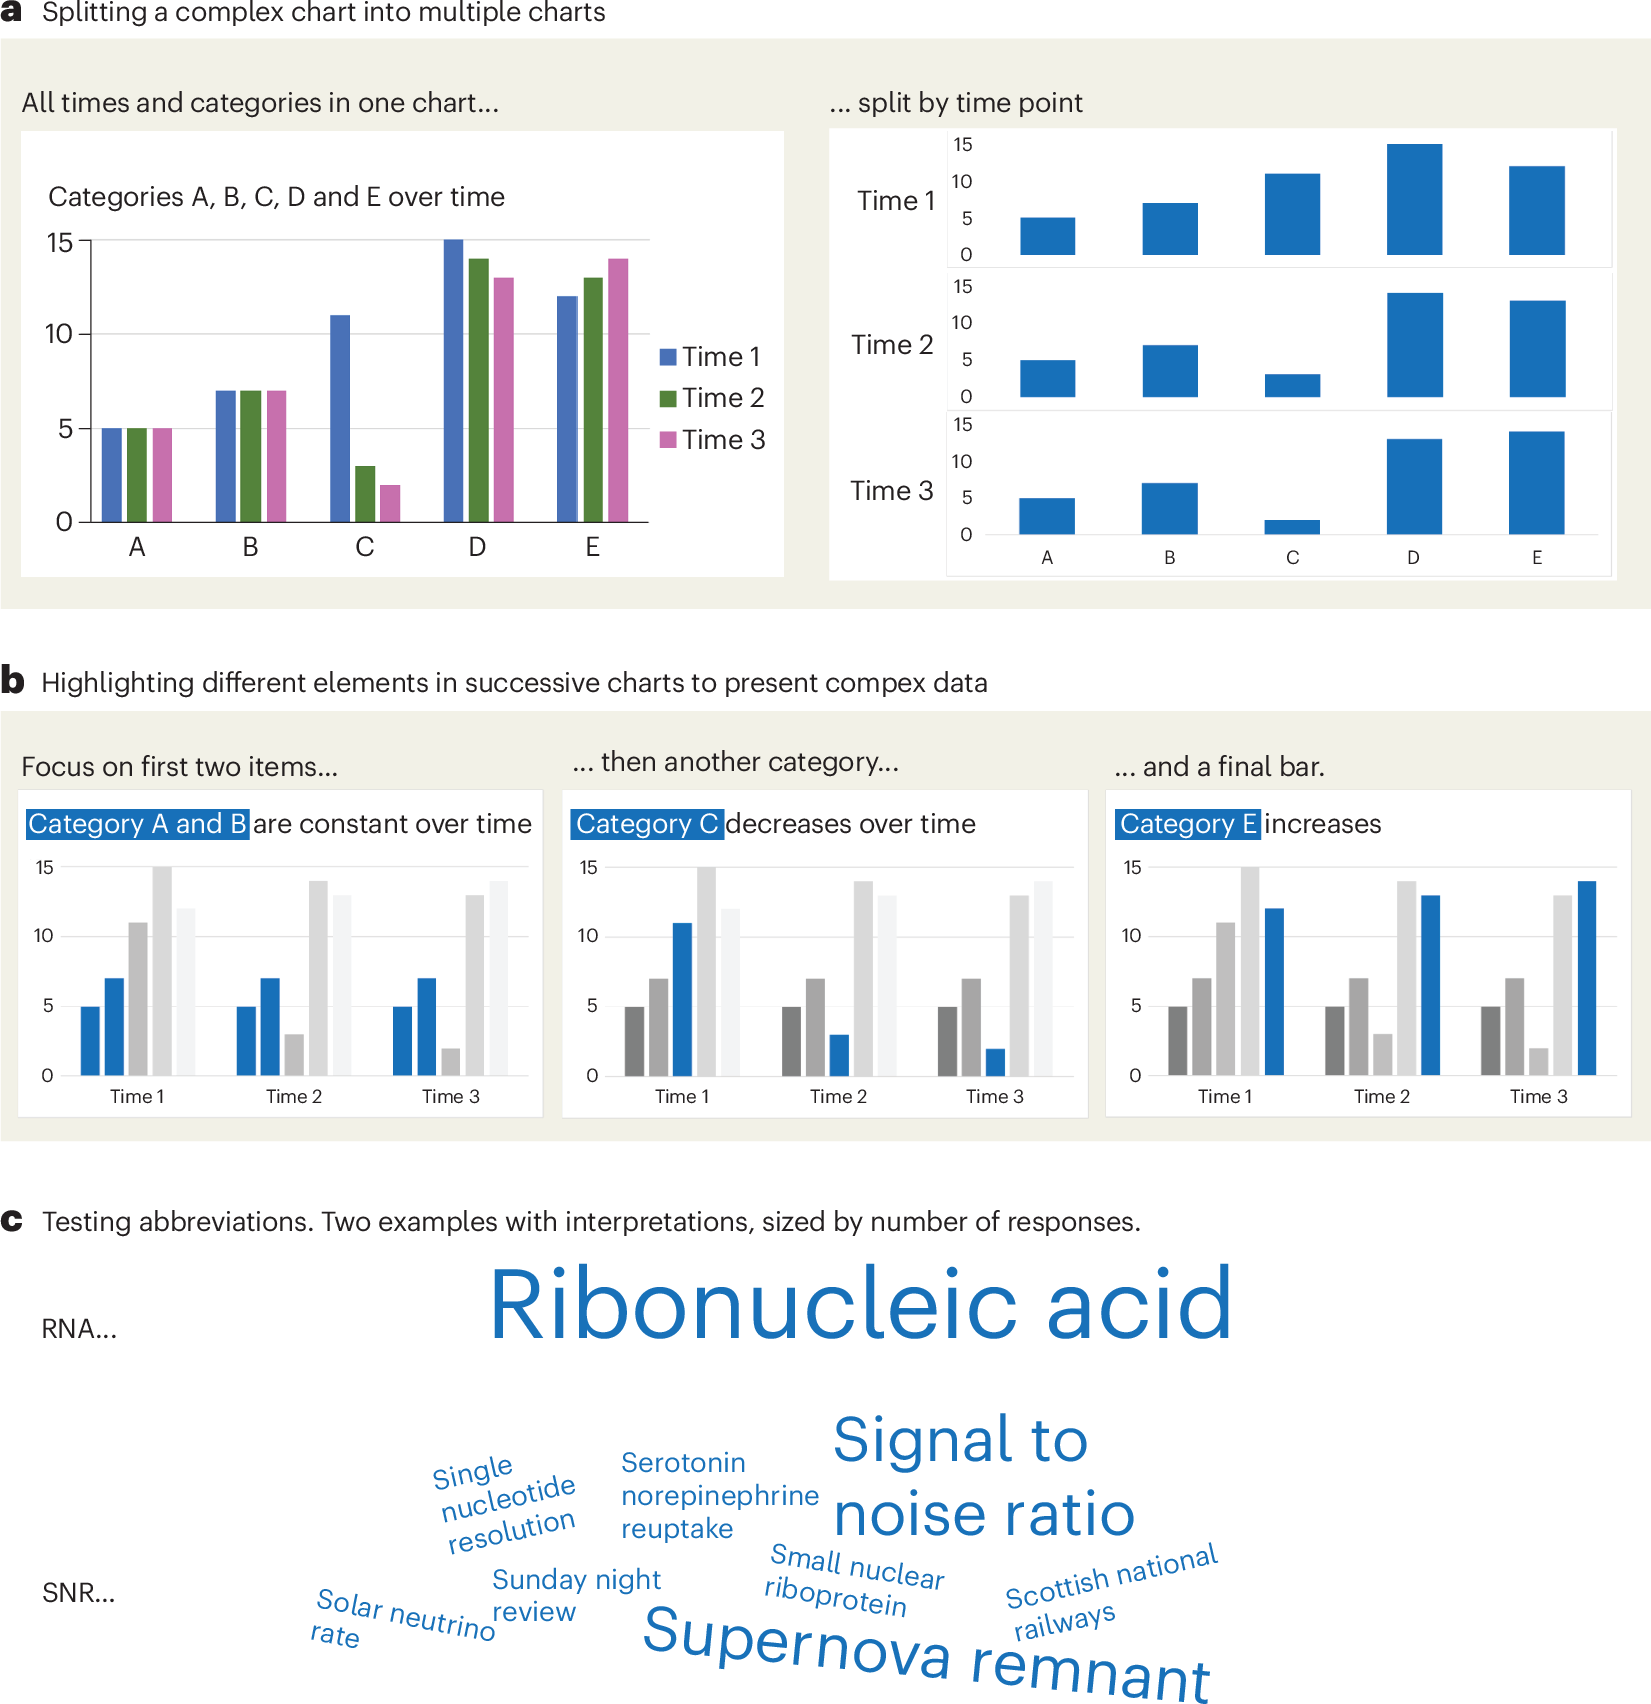
A checklist for designing and improving the visualization of scientific data
Creating clear and engaging scientific figures is crucial to communicate complex data. In this Comment, I condense principles from design, visual perception and data visualization research in a checklist that can help researchers to improve their data visualization, by focusing on clarity, accessibility and design best practices.
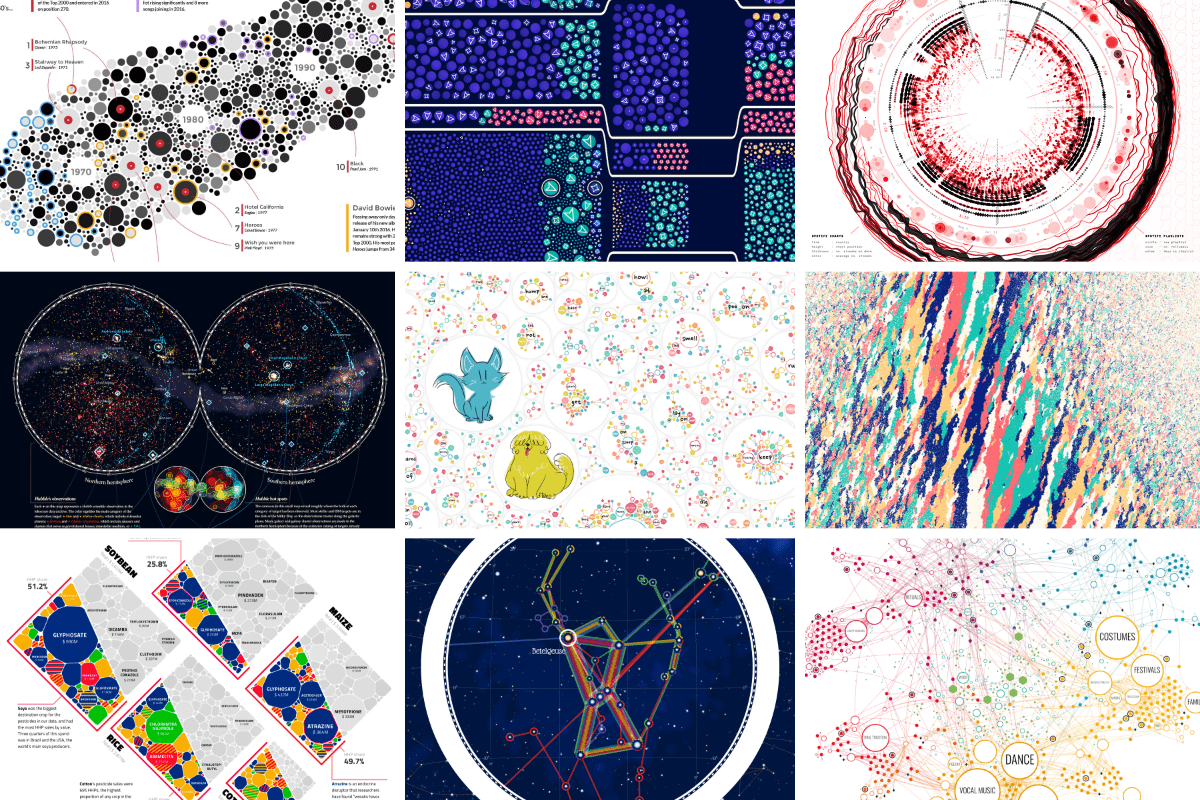
An Award-winning Data Visualization Designer
Visual Cinnamon | Data Visualization Design & Data Art | Data made insightful, effective & beautiful through data visualization and data art
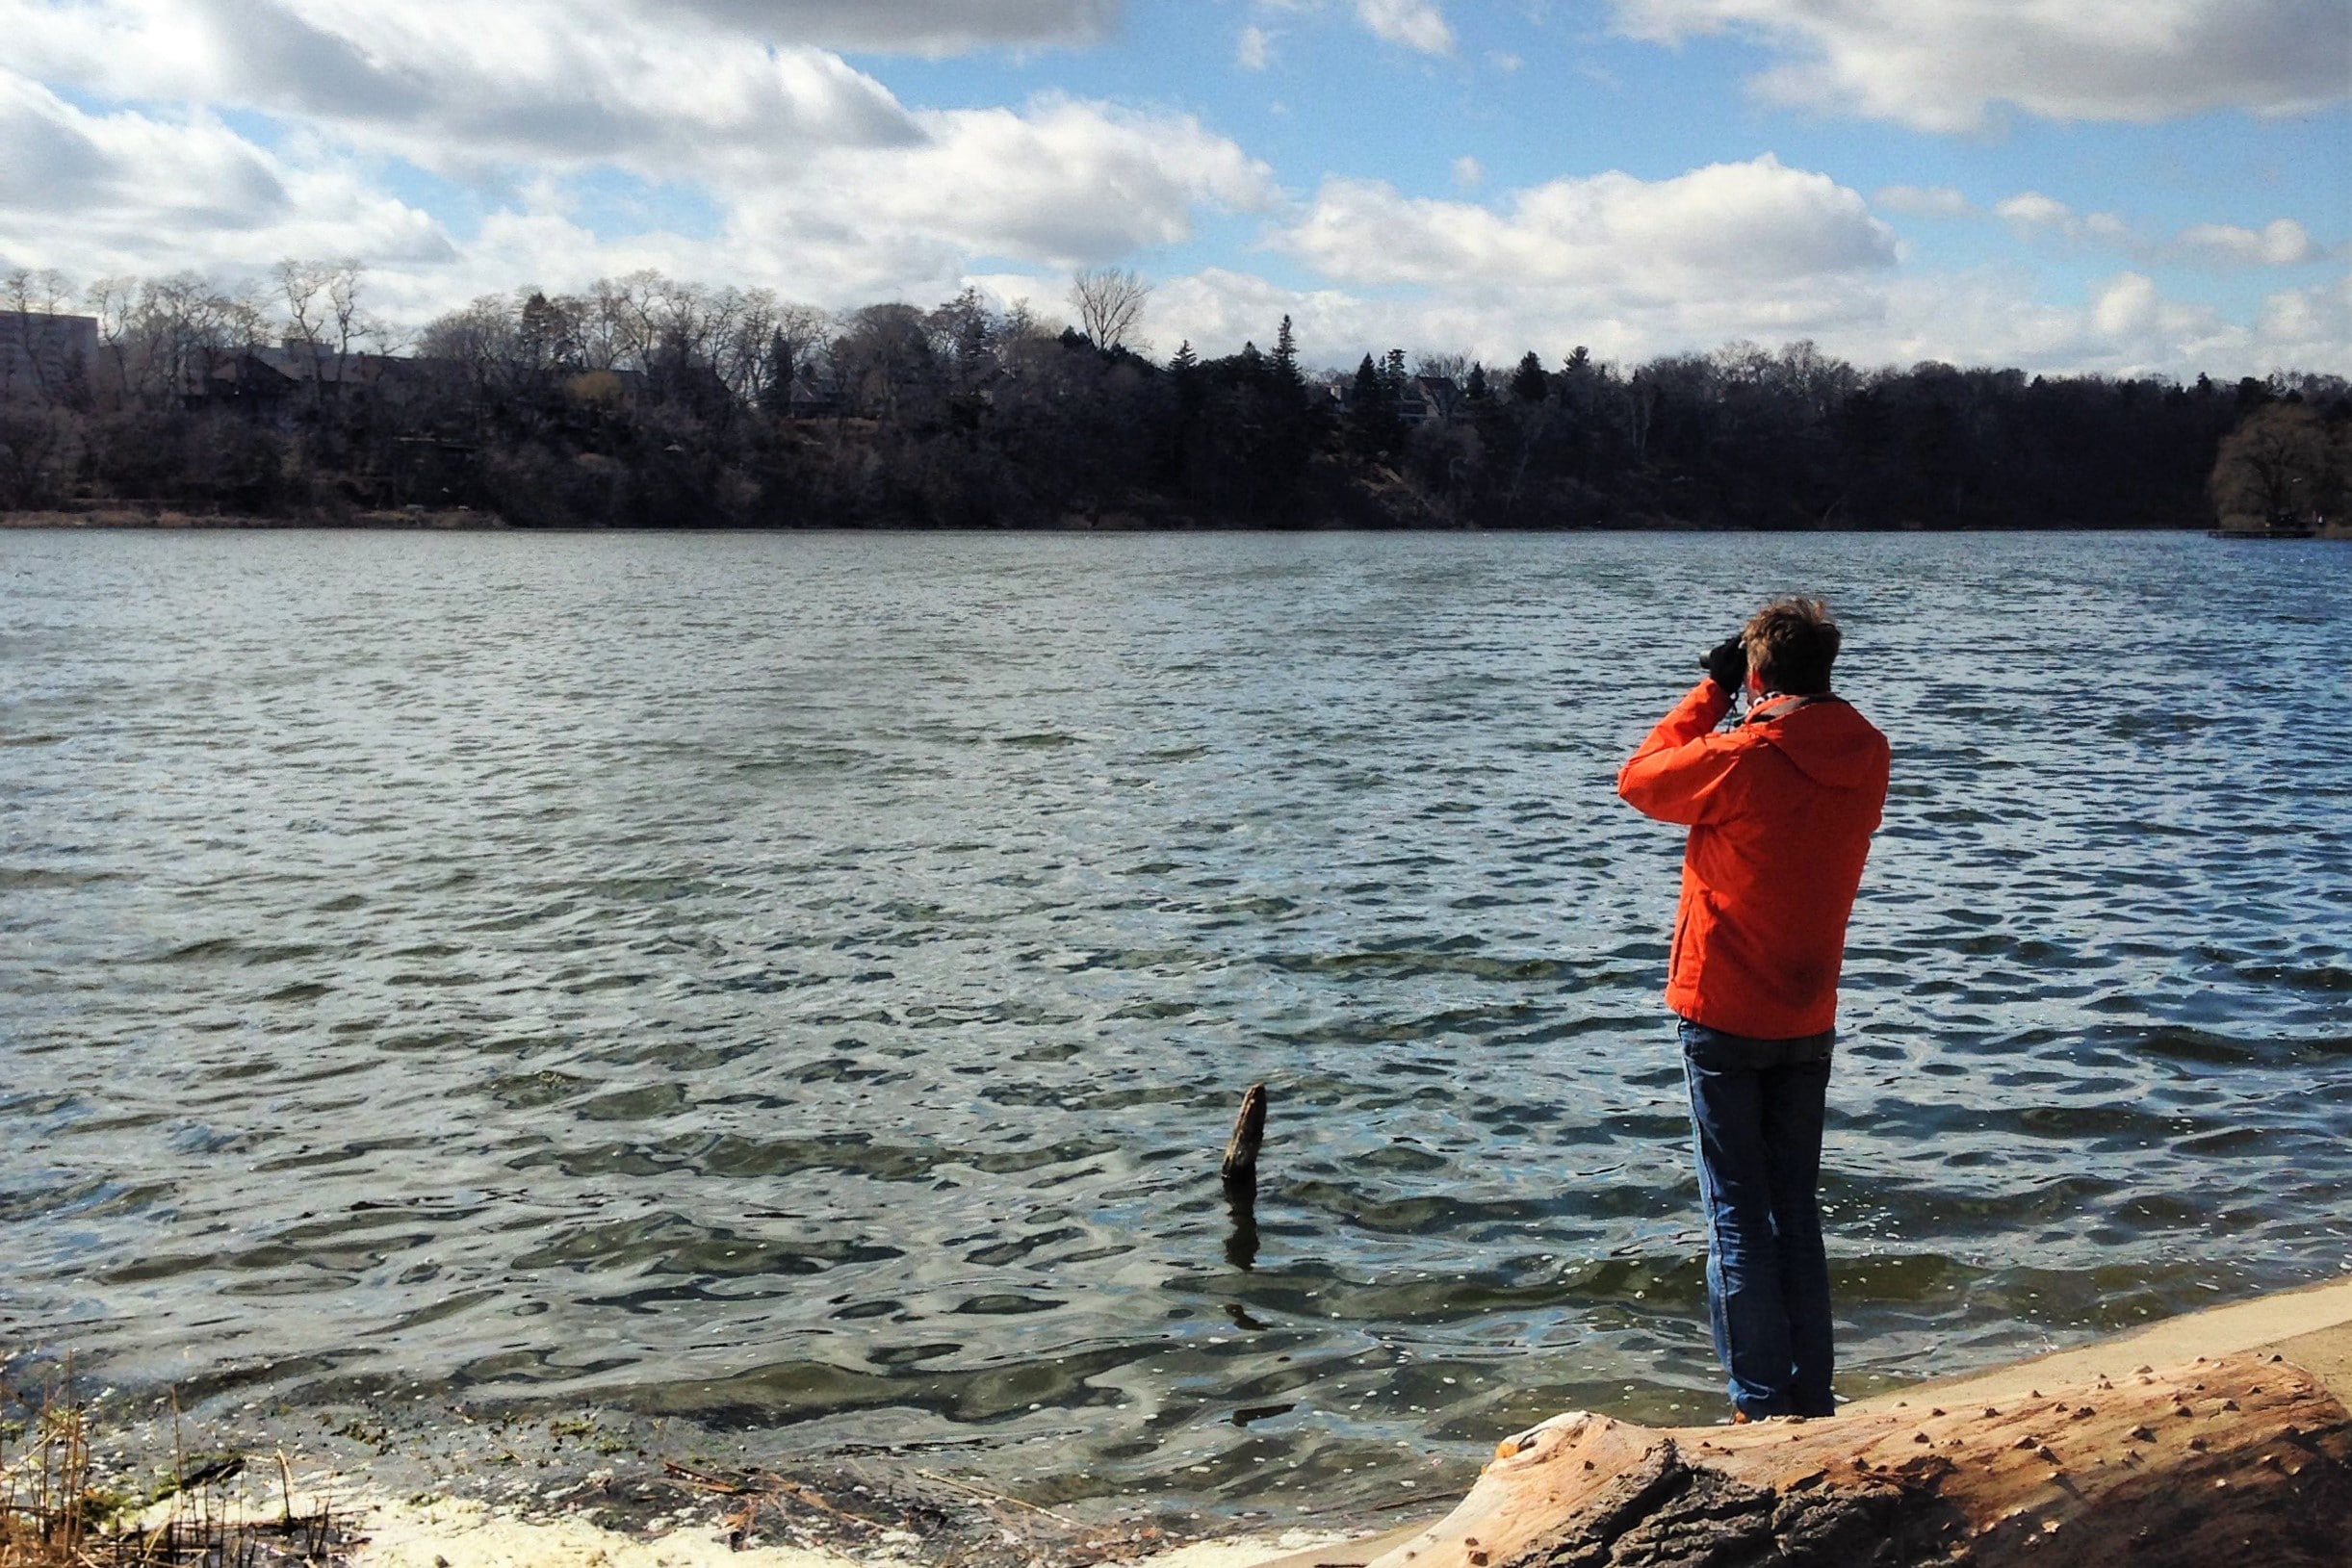
Taking imagery of bike lanes in Toronto: 60,000 photos later…
Imagery Update After a summer and fall of taking 360 imagery of bike lanes, I finished capturing street-level imagery of all the protected bike lanes in the City’s dataset. The last segment on November 8 was the final part of the new Harbord St bike lanes E of Grace St. So far, I’ve captured over…
ELI5 : What exactly is Aesthetic Visual Analysis?
I am a designer and I recently read about Netflix using an image discovery tool called AVA to generate frames from the content on their platform…
A Call for a Unified Database to Address Exposure Disparities in the United States
United States (US) drinking water quality is federally regulated under the Safe Drinking Water Act (SDWA) with the goal of ensuring clean, safe drinking water for the entire population. However, siting of pollution point sources in historically redlined communities with lower socioeconomic status and higher proportions of people of color adversely affects drinking water quality. Prior studies show higher concentrations of a suite of contaminants in small PWS, PWS in rural areas, and PWS serving greater proportions of people of color. Drinking water crises in Flint, Michigan (ca. 2014) and Jackson, Mississippi (ca. 2022) are visible examples of a chronic and widespread pattern of elevated exposures in certain communities. Comprehensive state monitoring data produced as part of compliance with the SDWA are presently not accessible to the public. Further, metadata on water treatment technology and sociodemographic composition of customers served are lacking. Here we argue that improving data transparency is essential for spearheading action to address exposure disparities. We propose the creation of a unified national public database on water quality, treatment technology, and customer metadata with accompanying visualizations for the public that leverage new AI tools. Public action to address exposure disparities gained momentum over the last 30 years but was halted abruptly in 2025. Therefore, new partnerships are urgently needed to continue the pursuit of environmental justice.,

IPFS (@ipfs.tech)
🪩 Introducing matadisco.org! — a way to discover open datasets via #atproto that doesn't depend on any single institution staying online. 🕺🏼 We have more public data than ever (satellite imagery, climate models, genomic sequences), but finding it is still painfully hard. https://matadisco.org
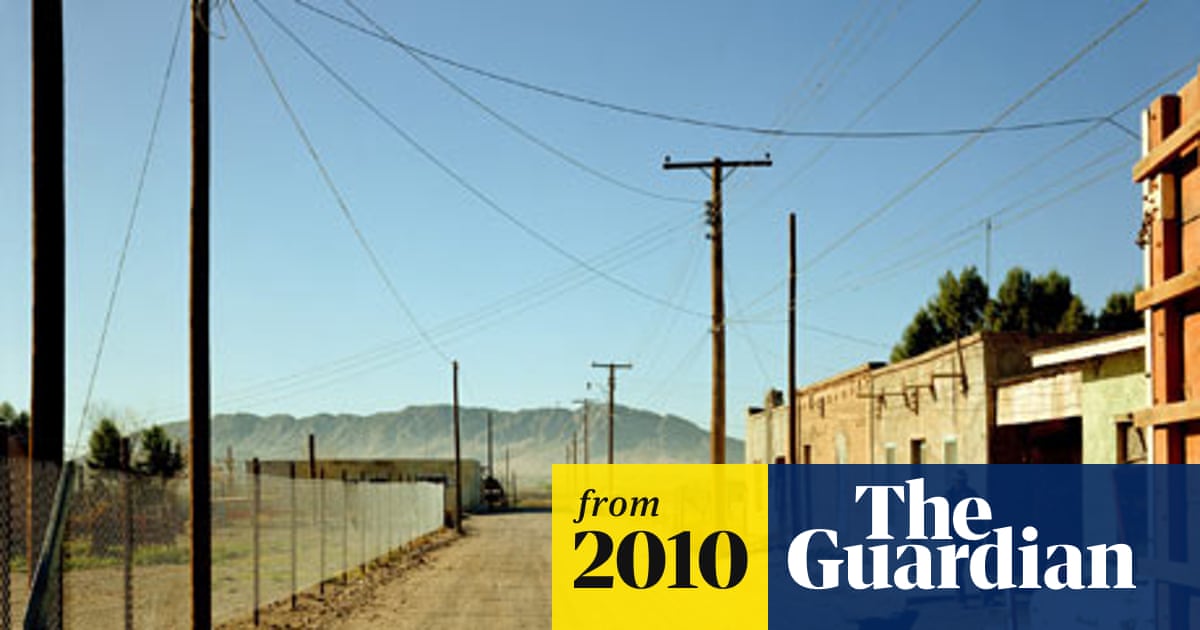
New Topographics: photographs that find beauty in the banal
William Jenkins's 1975 exhibition rewrote the rules of landscape photography. Does it have the same impact today?