


Make dense data tables readable—remove clutter, align to a grid, and let the numbers speak.
Teaching Data Science by Visualizing Data Table Transformations: Pandas Tutor for Python, Tidy Data Tutor for R, and SQL Tutor
As part of the Digital Library's transition to Open Access, new features for researchers are available in the Premium Edition. Click here to learn more.
A checklist for designing and improving the visualization of scientific data
Creating clear and engaging scientific figures is crucial to communicate complex data. In this Comment, I condense principles from design, visual perception and data visualization research in a checklist that can help researchers to improve their data visualization, by focusing on clarity, accessibility and design best practices.
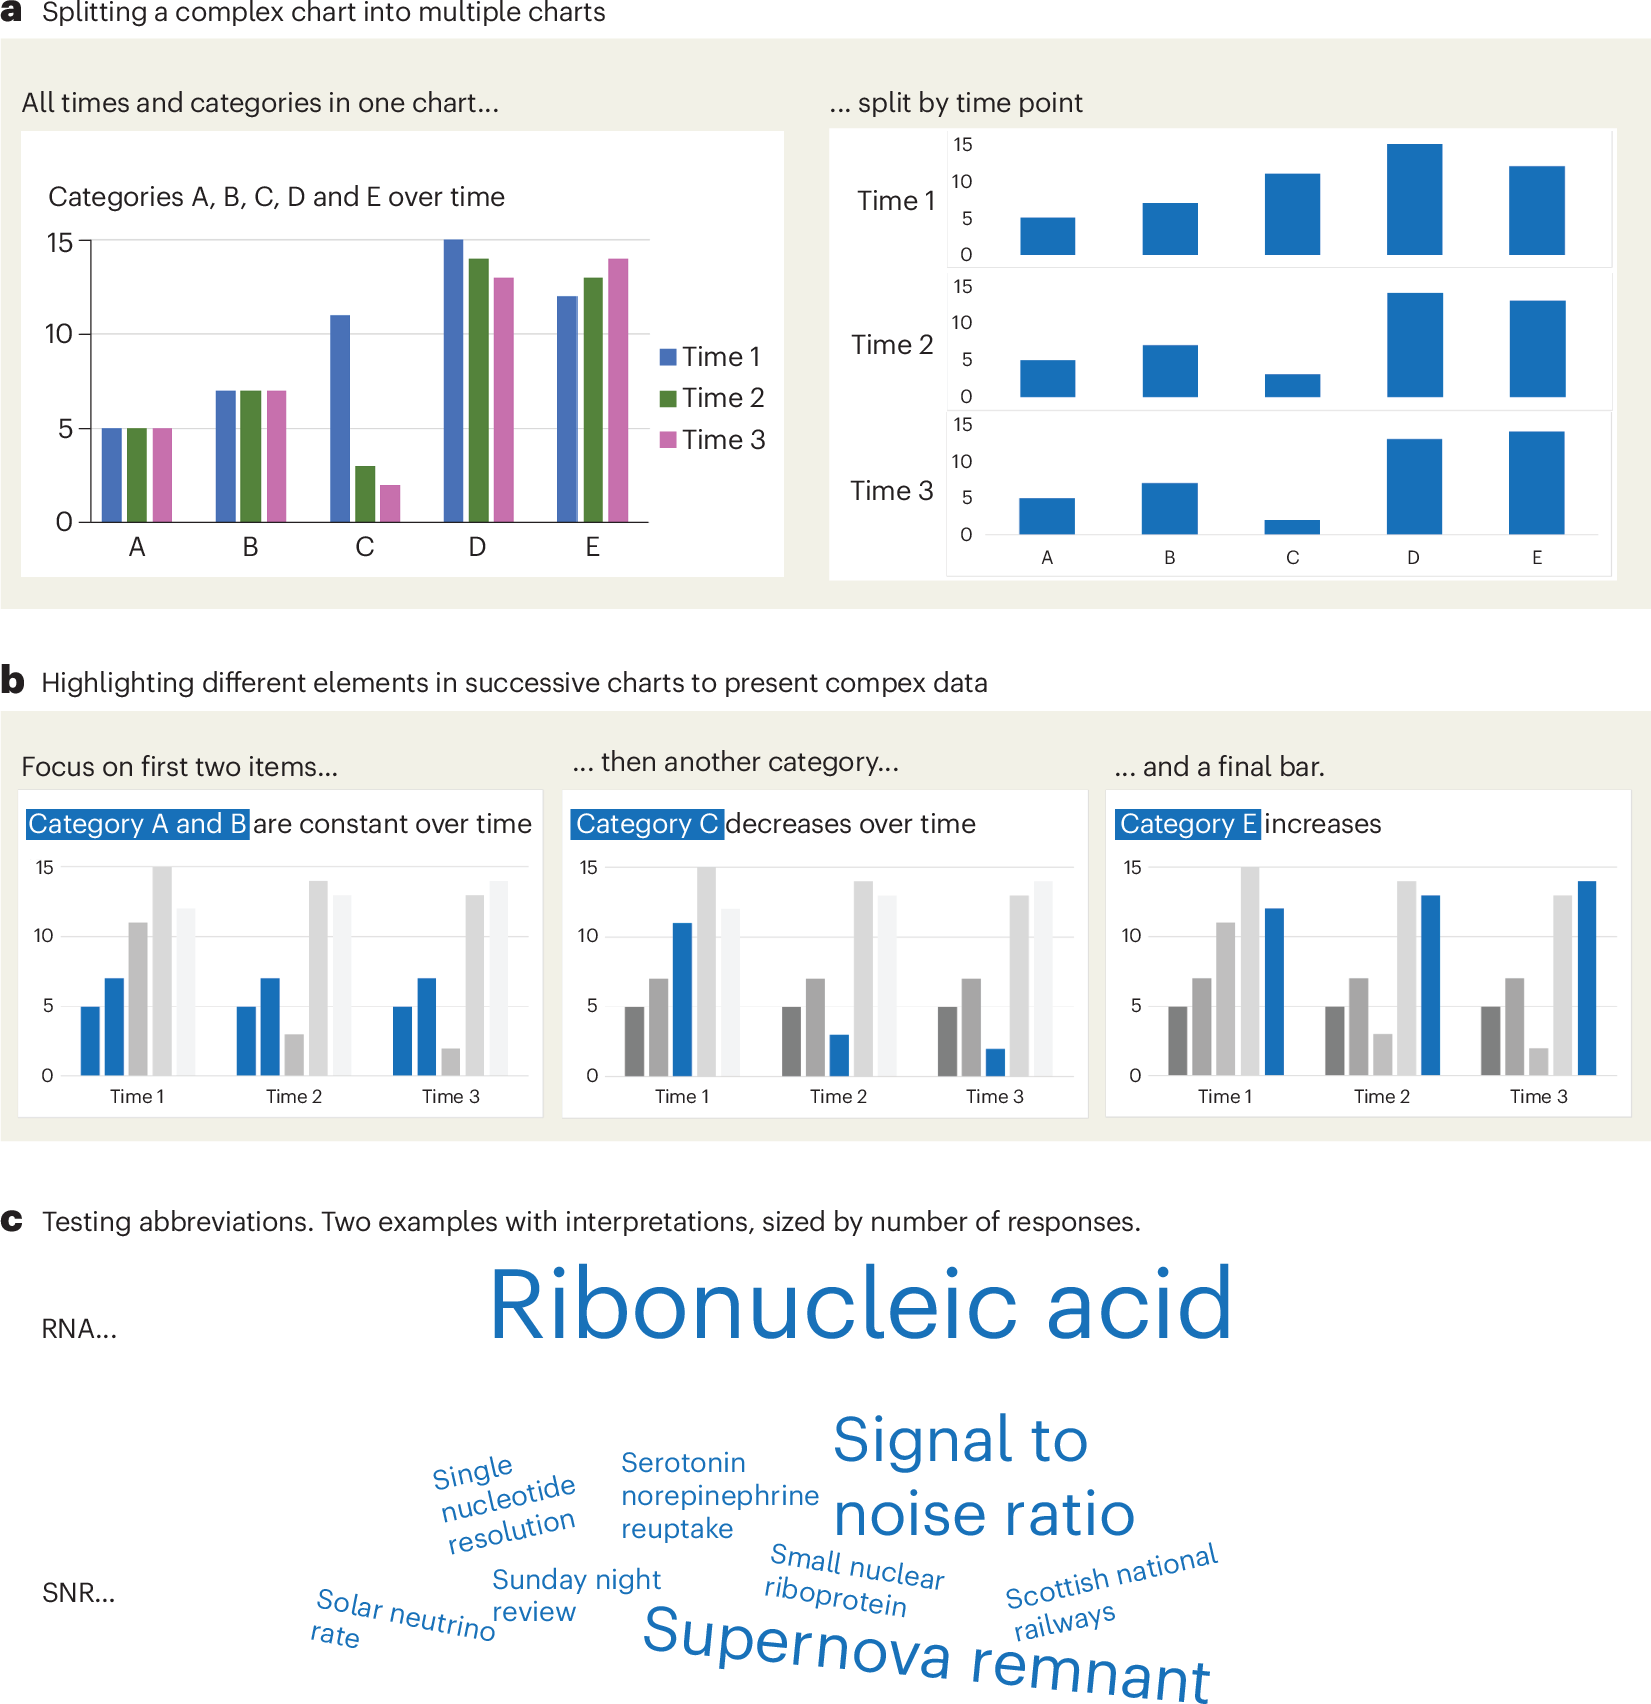
Chart Design Principles | Hands-On Data Visualization
Tell your story and show it with data, using free and easy-to-learn tools on the web. This introductory book teaches you how to design interactive charts and customized maps for your website, beginning with easy drag-and-drop tools, such as Google Sheets, Datawrapper, and Tableau Public. You will also gradually learn how to edit open-source code templates built with Chart.js, Highcharts, and Leaflet on GitHub. Follow along with the step-by-step tutorials, real-world examples, and online resources. This book is ideal for students, non-profit organizations, small business owners, local governments, journalists, academics, or anyone who wants to tell their story and show the data. No coding experience is required.
An Award-winning Data Visualization Designer
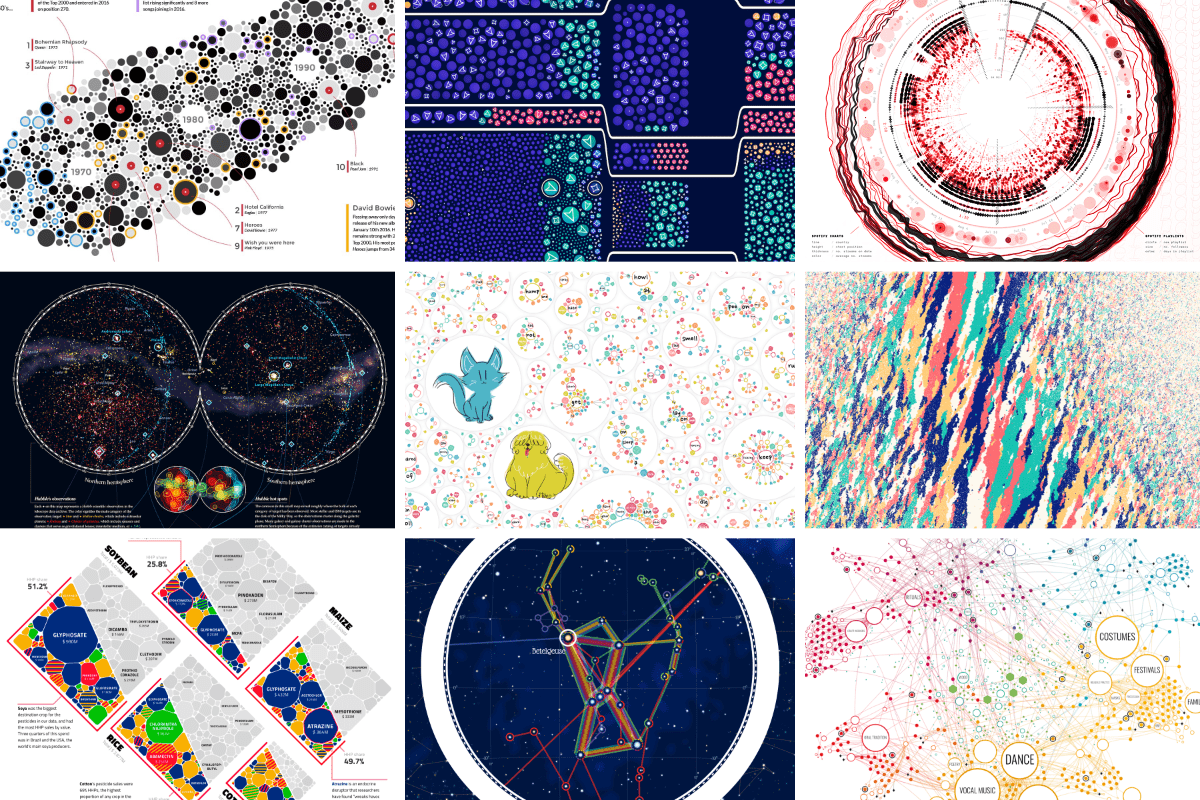
Visual Cinnamon | Data Visualization Design & Data Art | Data made insightful, effective & beautiful through data visualization and data art
Times Tables — Learn, Play and Print the Multiplication Tables
Practise every times table from 1 to 12 with free games, speed tests, printable charts and worksheets. Works on phones, tablets and computers. No sign-up.
Show me the data - Design Notes
Styling Tables the Modern CSS Way
Modern CSS makes styling HTML tables in a considered, responsive nature a breeze. Michelle Barker breaks it all down for you in this deep dive.
TanStack Table
Supercharge your tables or build a datagrid from scratch for TS/JS, React, Vue, Solid, Svelte, Qwik, Angular, and Lit while retaining 100% control over markup and styles.


Defense Against Dishonest Charts
This is a guide to protect ourselves and to preserve what is good about turning data into visual things.
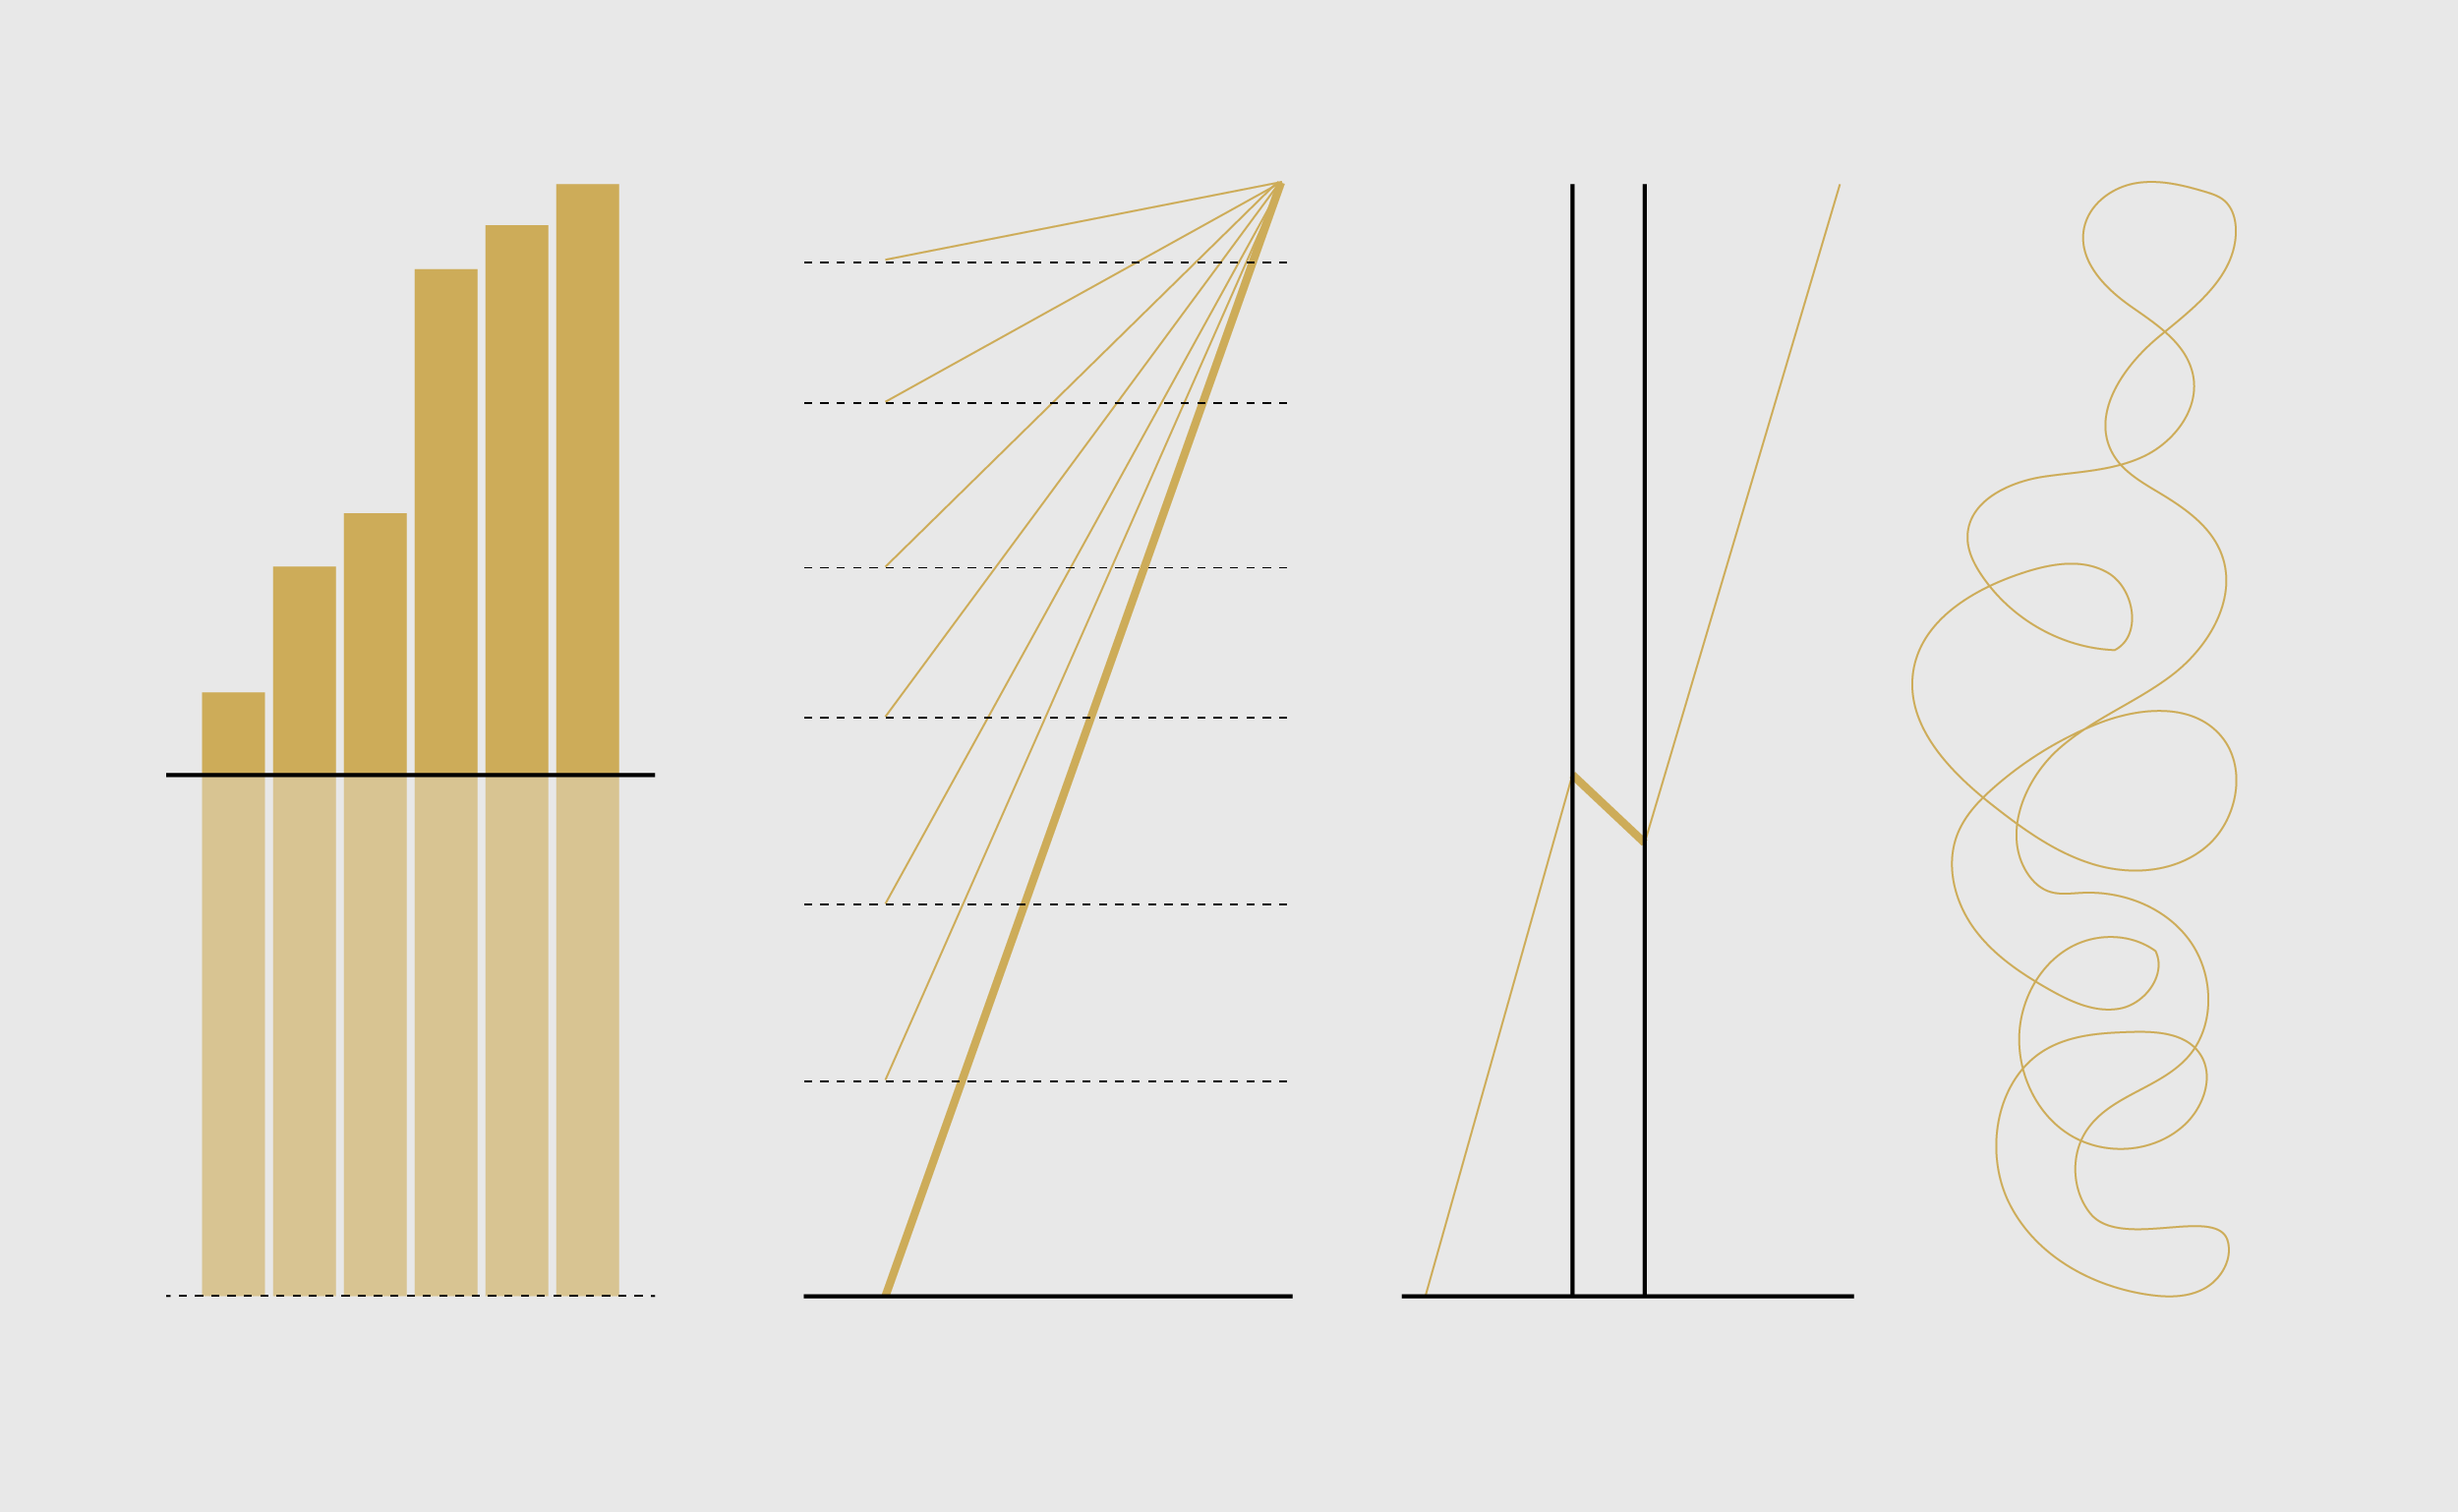
Cosmograph: Beautiful Visualization and Analytics | Cosmograph
Beautiful Visualization and Analytics

Datasets Guide | Unsloth Documentation
Learn how to create & prepare a dataset for fine-tuning.

Open source Business Intelligence and Embedded Analytics
Metabase open source business intelligence and embedded analytics. Create and share dashboards. Dig deeper into your data with no-code tools for data visualization.
tfw @aaronstevenwhite.io brings an analysis as sharp as a knife to your half-baked Saturday-morning thoughts: aaronstevenwhite.leaflet.pub/3miwsz2hdv22i 🤯 If we're going to own our data, let's actually own our data. Which is to say: No, really, y'all, we're doing this. 💖🧠

Machine-readable attitudes - Computational Semantics++
aaronstevenwhite.leaflet.pub