


A calculator that allows users to translate abstract greenhouse gas amounts into concrete terms that are easy to understand.
The Truth About Carbon Footprints
Carbon footprints & carbon footprint calculators are a marketing tool to make individuals feel guilty for Big Oil's pollution. See how the oil industry is blaming you and me.
SCI — Software Carbon Intensity | Green Software Foundation
The global standard for calculating and reducing the carbon emissions of your software. ISO/IEC 21031:2024.

Preliminary US Greenhouse Gas Emissions Estimates for 2025
Based on preliminary economic and energy activity data, we estimate that in 2025, US greenhouse gas emissions increased by 2.4%, marking a change from the prior two years of decreases in emissions.

Les émissions de CO₂ de Google et d’Amazon bondissent, propulsées par l’essor de l’IA
Les émissions totales de Google ont augmenté de 82 % depuis 2019 alors que le groupe s’était engagé à les réduire de moitié d’ici à 2030. Celles d’Amazon ont grimpé de 58 % au cours de la même période, malgré une neutralité carbone promise pour 2040.
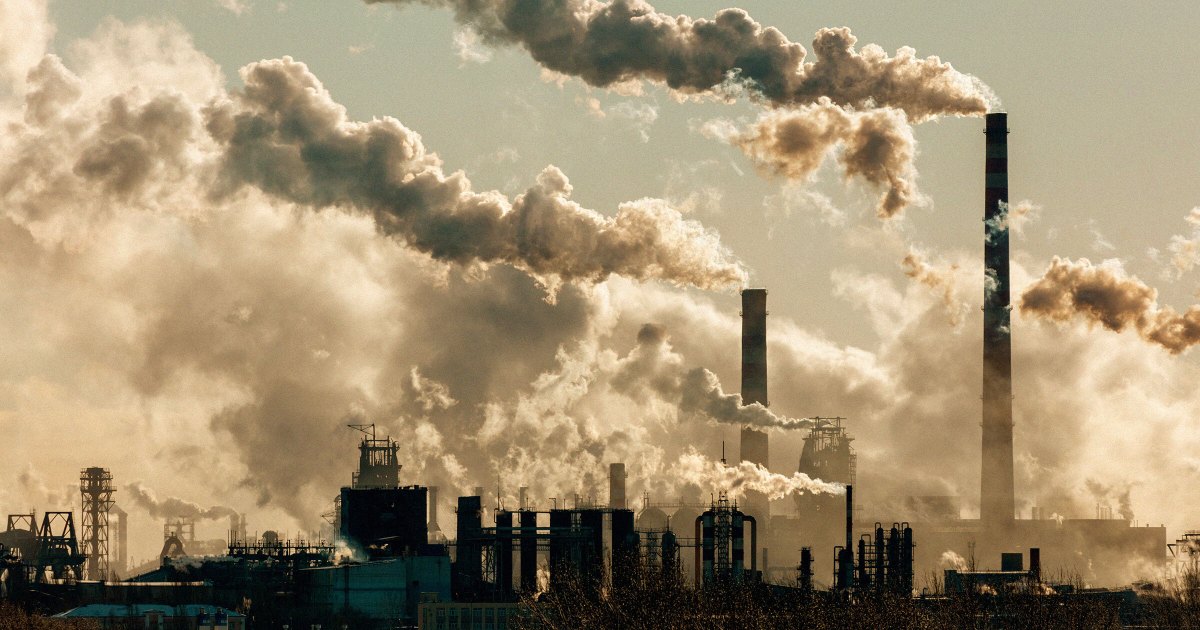
Trump’s EPA Will Let Power Companies Unleash Unlimited Greenhouse Gas Pollution
Trump's EPA announced new changes that will eliminate federal limits on greenhouse gas emissions produced by power plants.
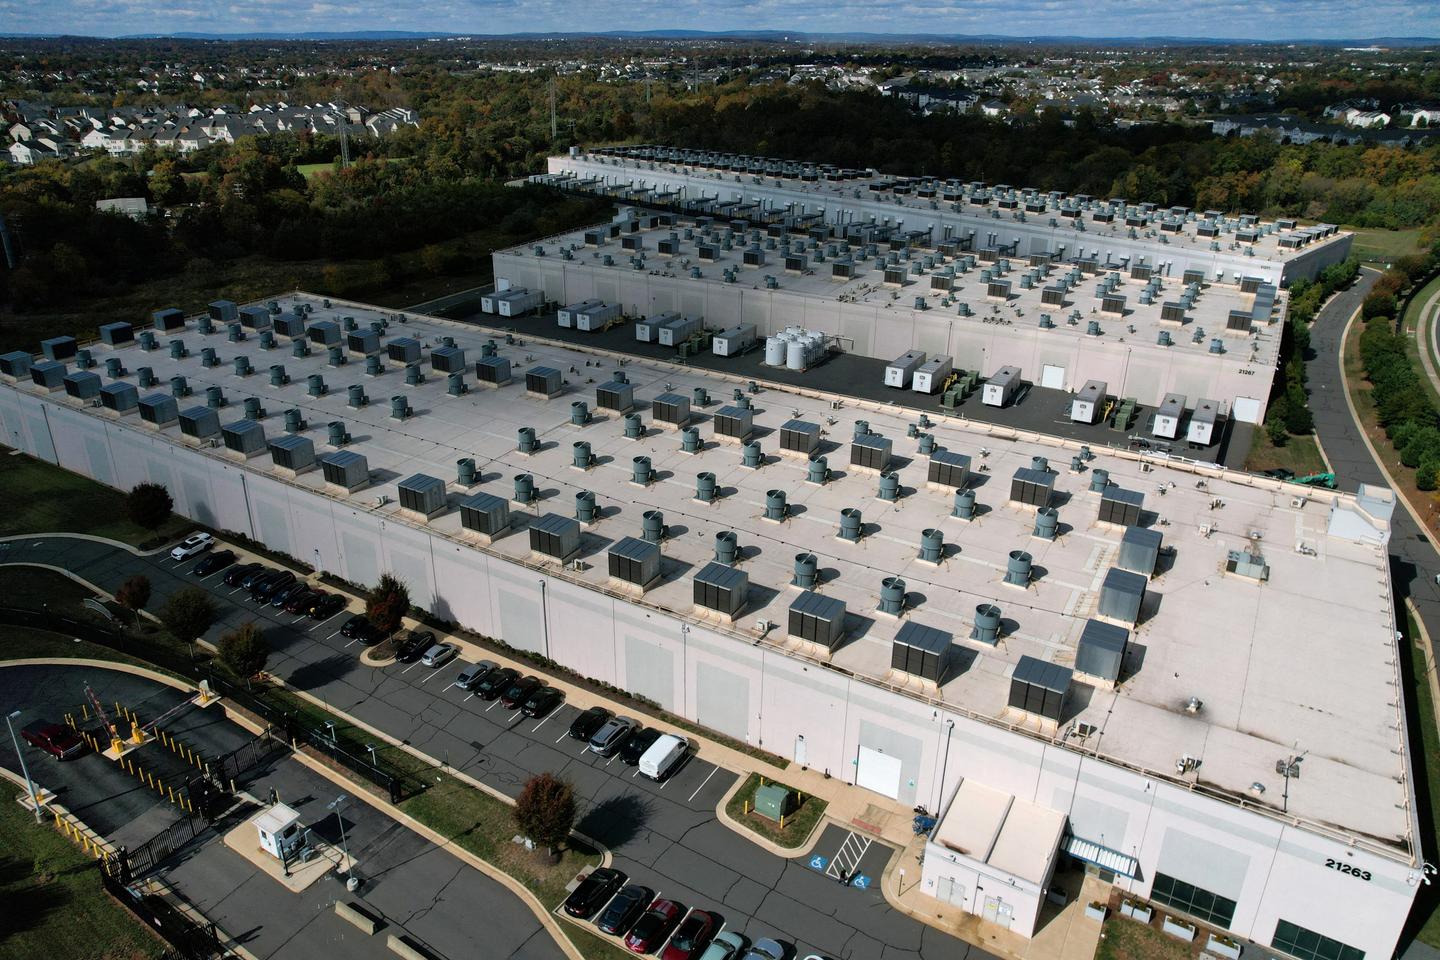
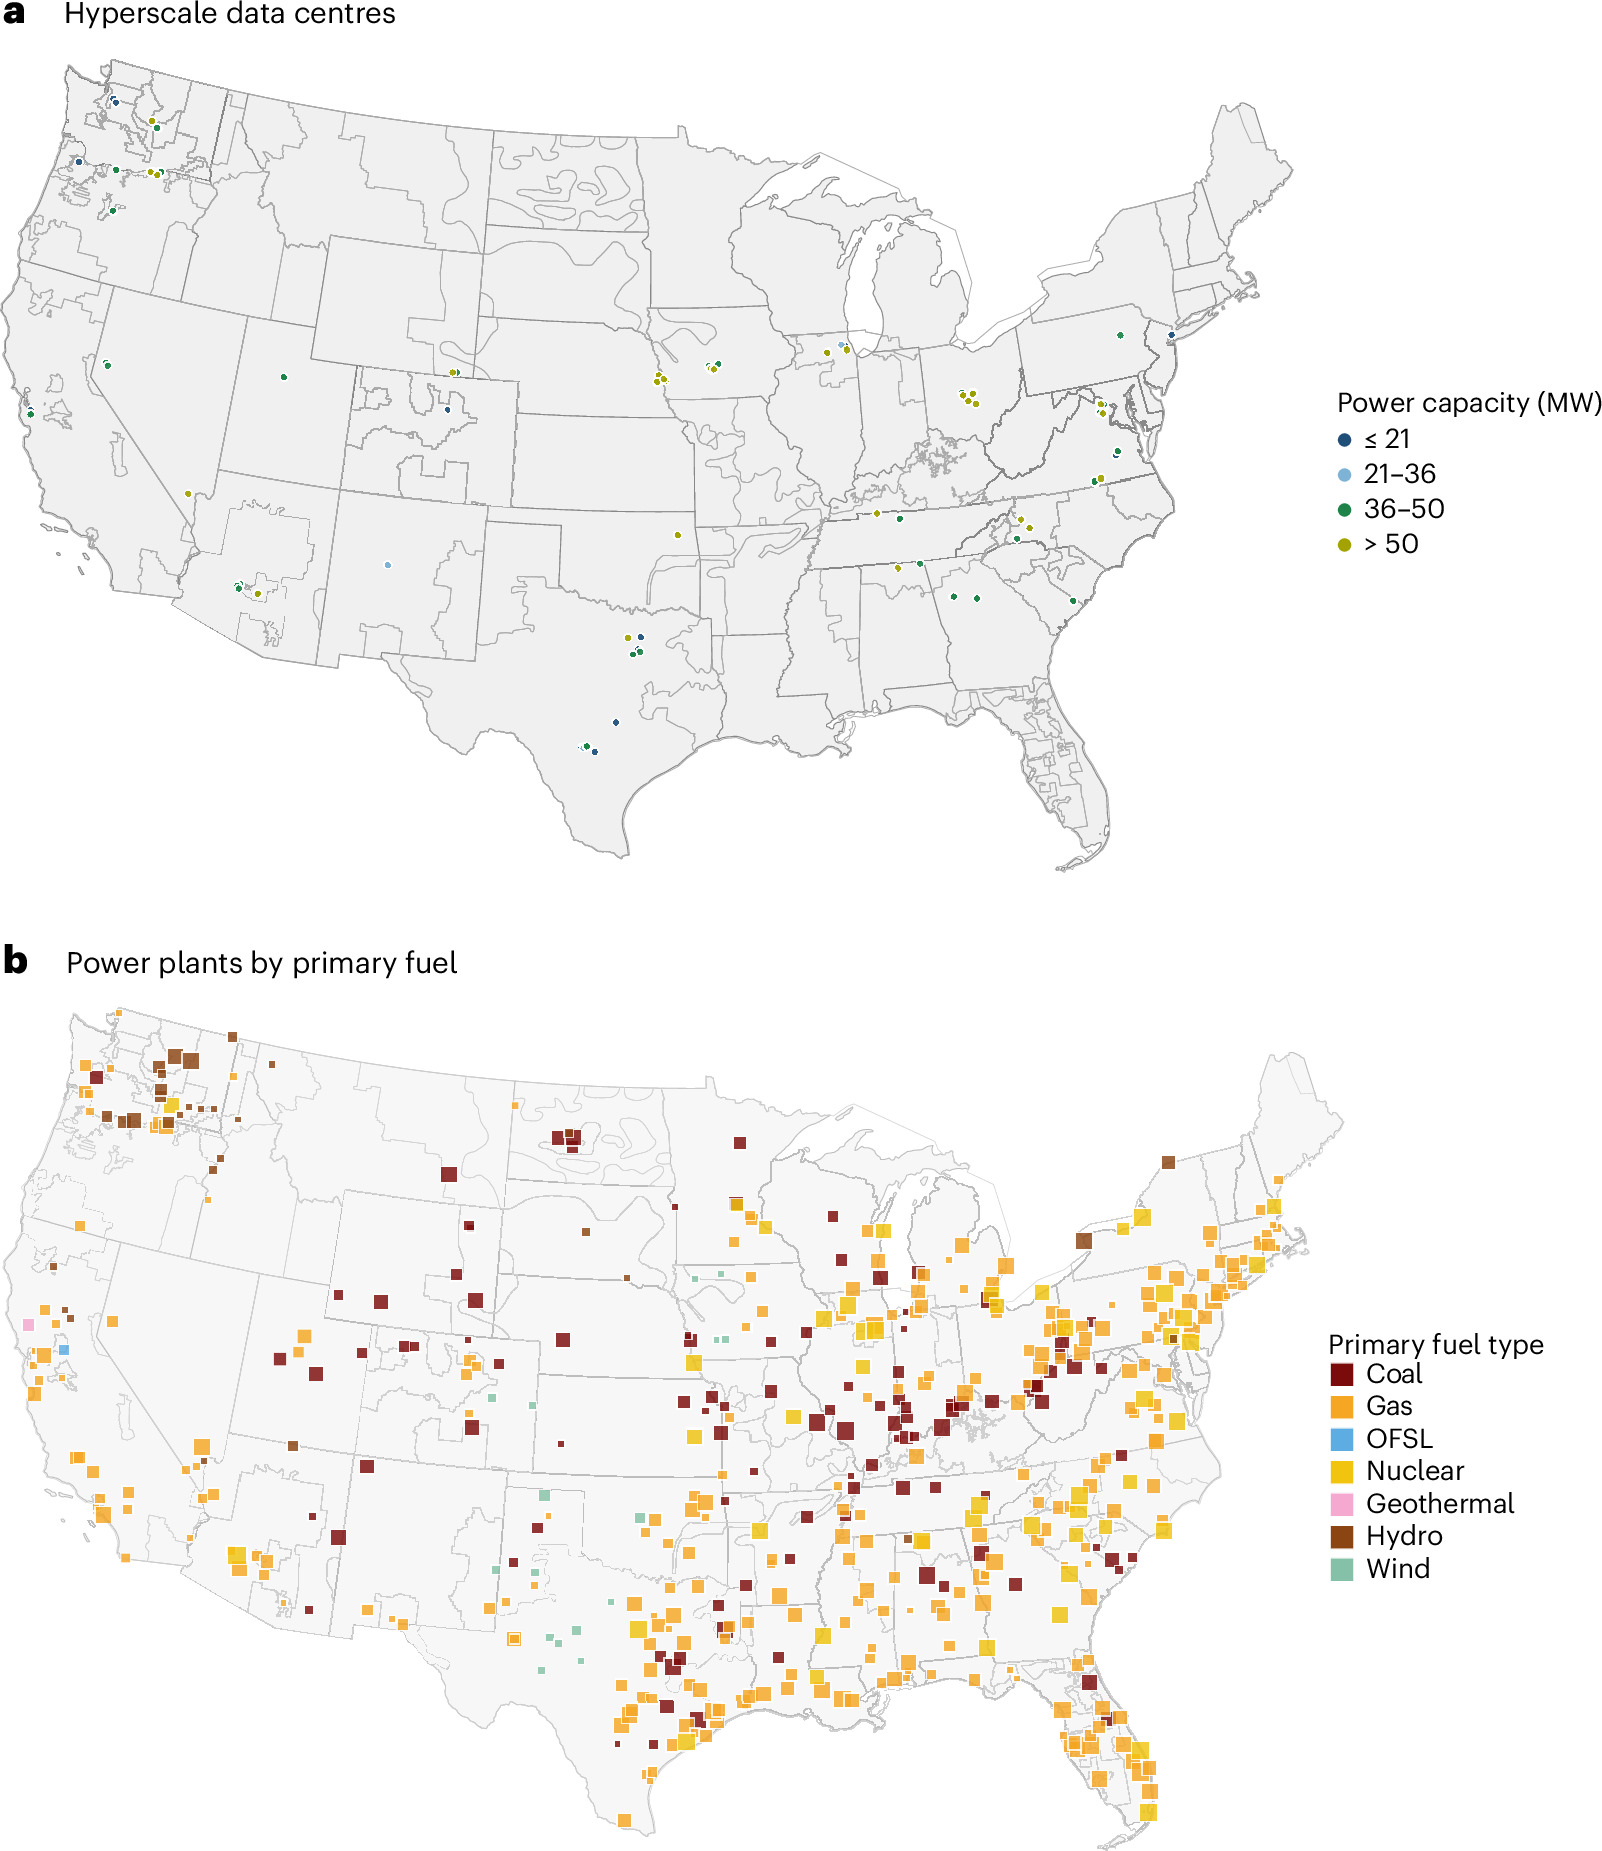
Assessing the carbon emissions and energy consumption of US hyperscale data centres
The rapid proliferation of hyperscale data centres (HDCs) in the USA—mainly driven by the adoption of artificial intelligence—has raised concerns about this industry’s carbon footprint. We compiled facility-level information on 403 US hyperscale data centres operating between May 2024 and April 2025 and estimated their electricity consumption, electricity sources and attributable CO2 emissions. Across facility-load scenarios, these HDCs consumed approximately 68–99 TWh of electricity and were associated with approximately 21–31 million metric tons of CO2 under a location-based, total-output balancing-authority attribution method. Under the central scenario, HDC electricity demand was approximately 82 TWh, corresponding to about 1.8% of total US electricity consumption, and attributable CO2 emissions were approximately 25.7 Mt. Roughly 54% of attributed generation was supplied by fossil-fuel sources. The HDC electricity-weighted total-output carbon intensity was approximately 314 gCO2 kWh−1, compared with a US total-output average of approximately 348 gCO2 kWh−1. Our approach provides a facility-resolved attributional framework for assessing the carbon footprint of hyperscale data centres using plant-level electricity-generation and emissions data.
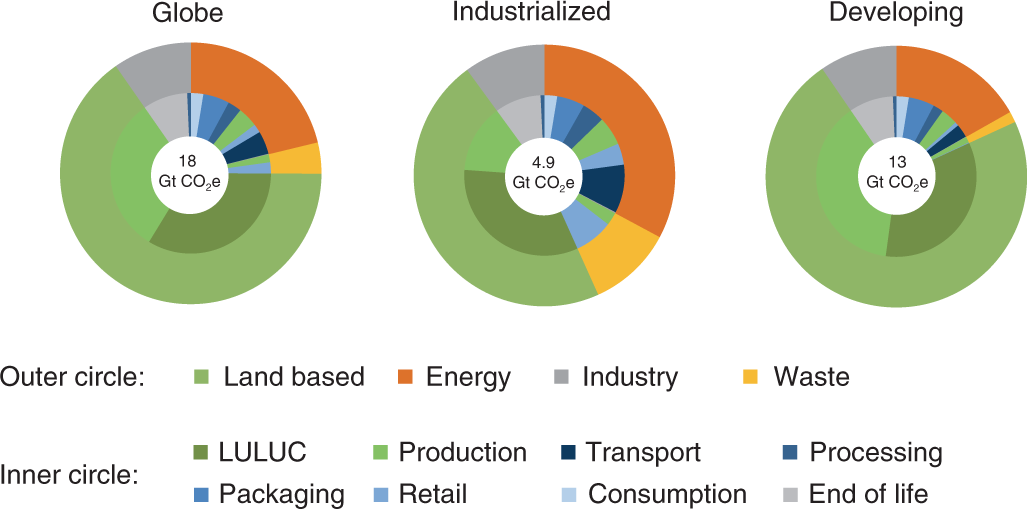
Food systems are responsible for a third of global anthropogenic GHG emissions
We have developed a new global food emissions database (EDGAR-FOOD) estimating greenhouse gas (GHG; CO2, CH4, N2O, fluorinated gases) emissions for the years 1990–2015, building on the Emissions Database of Global Atmospheric Research (EDGAR), complemented with land use/land-use change emissions from the FAOSTAT emissions database. EDGAR-FOOD provides a complete and consistent database in time and space of GHG emissions from the global food system, from production to consumption, including processing, transport and packaging. It responds to the lack of detailed data for many countries by providing sectoral contributions to food-system emissions that are essential for the design of effective mitigation actions. In 2015, food-system emissions amounted to 18 Gt CO2 equivalent per year globally, representing 34% of total GHG emissions. The largest contribution came from agriculture and land use/land-use change activities (71%), with the remaining were from supply chain activities: retail, transport, consumption, fuel production, waste management, industrial processes and packaging. Temporal trends and regional contributions of GHG emissions from the food system are also discussed.
New Gas-Powered Data Centers Could Emit More Greenhouse Gases Than Entire Nations
A WIRED review of permits for data center projects using natural gas and linked to OpenAI, Meta, Microsoft, and xAI shows they could emit more than 129 million tons of greenhouse gases per year.

PluginSolarCalculator.com | Independent UK Plug-In Solar Guide
Independent UK guides, tools and product tracking for plug-in solar. Understand the rules, estimate savings and payback, and find compliant kits.

The Climate Solution Actually Adding Millions of Tons of CO2 Into the Atmosphere — ProPublica
New research shows that California’s climate policy created up to 39 million carbon credits that aren’t achieving real carbon savings. But companies can buy these forest offsets to justify polluting more anyway.

Carbon Removal Technologies | YC Request for Startups
Climate change presents an existential threat to humanity. We are already seeing the effects and they are showing up faster and stronger than anticipated. A report by United Nations' scientific panel on climate change released this month expects the atmosphere-on our current trajectory-to warm up by 1.5 degrees Celsius by 2040. Even the effects of a 0.5 degrees increase will have far-reaching consequences. This research indicates that we are already past the tipping point; even if we significantly reduced emissions, climate change would continue (Source IPCC summary C3 section). We believe there's still time to make a change if we look both to renewal energy and CO2 removal.

Numbat - scientific calculator
High precision scientific calculator with full support for physical units.

A trade-off between plant and soil carbon storage under elevated CO2
Terrestrial ecosystems remove about 30 per cent of the carbon dioxide (CO2) emitted by human activities each year1, yet the persistence of this carbon sink depends partly on how plant biomass and soil organic carbon (SOC) stocks respond to future increases in atmospheric CO2 (refs. 2,3). Although plant biomass often increases in elevated CO2 (eCO2) experiments4–6, SOC has been observed to increase, remain unchanged or even decline7. The mechanisms that drive this variation across experiments remain poorly understood, creating uncertainty in climate projections8,9. Here we synthesized data from 108 eCO2 experiments and found that the effect of eCO2 on SOC stocks is best explained by a negative relationship with plant biomass: when plant biomass is strongly stimulated by eCO2, SOC storage declines; conversely, when biomass is weakly stimulated, SOC storage increases. This trade-off appears to be related to plant nutrient acquisition, in which plants increase their biomass by mining the soil for nutrients, which decreases SOC storage. We found that, overall, SOC stocks increase with eCO2 in grasslands (8 ± 2 per cent) but not in forests (0 ± 2 per cent), even though plant biomass in grasslands increase less (9 ± 3 per cent) than in forests (23 ± 2 per cent). Ecosystem models do not reproduce this trade-off, which implies that projections of SOC may need to be revised.

Free Calculators & Tech Insights - The Pastry Box Project
Discover free online calculators for everyday problems and clear articles about technology. Simple tools and insights to make life easier.
Key Principles for the Intergovernmental Science–Policy Panel on Chemicals and Waste
In 2021, the United Nations Environment Programme (UNEP) recognized chemical pollution as a planetary crisis tantamount to climate change and biodiversity

Please consult the official Bloomberg estimate of Scope 1+2+3 combined total GHG emissions for the 500 largest public companies in the US, which I have annotated for helpful context. Microsoft emits slightly more GHG than a toothpaste manufacturer (much more than NFLX), but far less than Pepsi.

Ketan Joshi
For some reason "AI is just like watching Netflix" is back in my feeds so I took that as a sign to update my data tracking for Netflix. The company's energy use rose 1% from 2021 to 2024. Compare that to: Google: 71% Nvidia: 88% Meta: 96% Microsoft: 119%
