

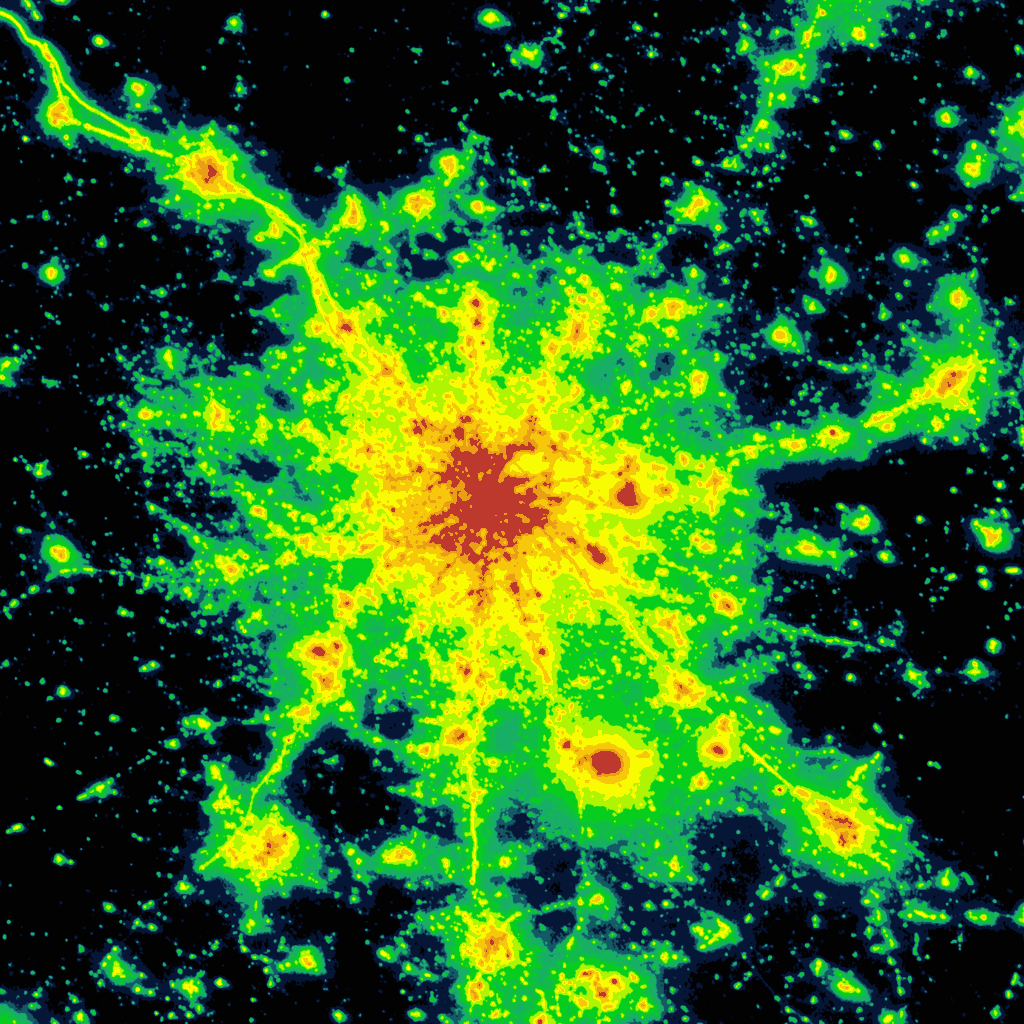
Interactive world light pollution map. The map uses NASA Black marble VIIRS, Sky brightness, Aurora prediction, observatories, clouds and SQM/SQC overlay contributed by users.
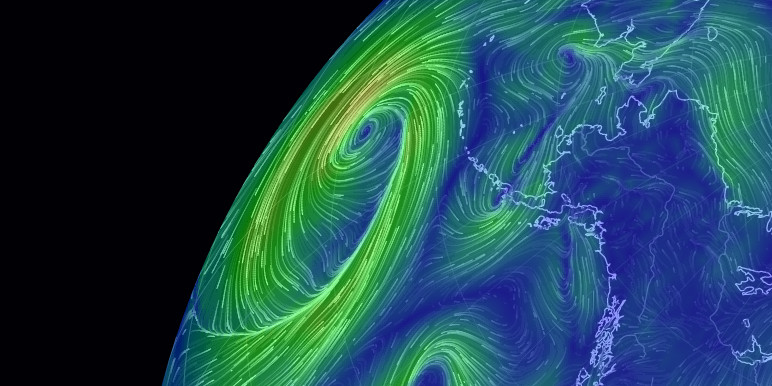
earth :: a global map of wind, weather, and ocean conditions
See current wind, weather, ocean, and pollution conditions, as forecast by supercomputers, on an interactive animated map. Updated every three hours.
We’re Squandering LEDs’ Potential to Save Our Night Skies
Bad decisions have turned efficient technology into a driver of light pollution. There is a better way

Bluesky Aurora Viewer
Posts form a noisy aurora trace from left to right, oldest to newest. Each post becomes a vertical green emission ray. Higher engagement produces brighter, harp-like rays with easier selection. Drag to orbit, mouse wheel to zoom, right-drag to pan, hover for a system overlay. Quote text is keyed to posts with a small dot-and-line marker.
Figure 9: The radiance curves of several LEDs useful to mimic the Black...
Download scientific diagram | The radiance curves of several LEDs useful to mimic the Black Body representative of the M stars (from M0 to M8 spectral type). The absorption spectra of several photosynthetic bacteria are also shown. from publication: Simulating super earth atmospheres in the laboratory | Several space missions, such as JWST, TESS and the very recently proposed ARIEL, or ground-based experiments, as SPHERE and GPI, have been proposed to measure the atmospheric transmission, reflection and emission spectra of extrasolar planets. The planet atmosphere... | Atmosphere, Earth and Extrasolar Planets | ResearchGate, the professional network for scientists.

Supported Services - Stargraph
Stargraph automatically maps Atmosphere profiles together. Find your friends and share your presence in one link.

Stargraph
Stargraph automatically maps Atmosphere profiles together. Find your friends and share your presence in one link.

A Beginner’s Guide to Scientific Roadmapping
Wonderful maps and how to read them
@paulmwatson.com - Stargraph
Stargraph automatically maps Atmosphere profiles together. Find your friends and share your presence in one link.
Fog of World - Experience a Richer Life
Fog of World is a real-life, travel and exploring game where you need to remove the fog on the map by exploring the world. It's a fantastic way to visualize everywhere you have been in your entire life or to discover places around you!

TESSERA: Precomputed FAIR Global Pixel Embeddings for Earth...
Petabytes of satellite Earth Observation (EO) data are freely available and can address critical global challenges. However, EO data quality is poor due to clouds and variable lighting conditions....

NASA Image and Video Library
NASA Image and Video Library, serving up consolidated imagery and videos in one searchable location. Users can download content in multiple sizes and resolutions and see the metadata associated with images, including EXIF/camera data on many images.
Visualising Climate 2026 — Conference
A global conference on climate data visualization, storytelling, and science. Bologna, Italy • 4–6 November 2026.
Atmospheric doesn’t have to be an app · Applied Meteorology
You can just build features into the websites you've already got!
Computational Education Commons on the Atmosphere - ATmosphereConf 2026
Atmosphere Conference News
News from the Atmosphere Community Conference, aka AtmosphereConf April 29th - May 2nd, 2027 • Amsterdam, The Netherlands
When the Scientists Showed Up: Notes from ATmosphereConf 2026 - Nightflight