


Satellite-based estimates of radiative forcing by aerosol–cloud interactions (RFaci) are consistently smaller than those from global models, hampering accurate projections of future climate change. Here we show that the discrepancy can be substantially reduced by correcting sampling biases induced by inherent limitations of satellite measurements, which tend to artificially discard the clouds with high cloud fraction. Those missed clouds exert a stronger cooling effect, and are more sensitive to aerosol perturbations. By accounting for the sampling biases, the magnitude of RFaci (from −0.38 to −0.59 W m−2) increases by 55 % globally (133 % over land and 33 % over ocean). Notably, the RFaci further increases to −1.09 W m−2 when switching total aerosol optical depth (AOD) to fine-mode AOD that is a better proxy for CCN than AOD. In contrast to previous weak satellite-based RFaci, the improved one substantially increases (especially over land), resolving a major difference with models.
The roles of aerosol direct and indirect effects in past and future climate change
Abstract Using the Geophysical Fluid Dynamics Laboratory's (GFDL's) fully coupled chemistry‐climate (ocean/atmosphere/land/sea ice) model (CM3) with an explicit physical representation of aerosol indirect effects (cloud‐water droplet activation), we find that the dramatic emission reductions (35%–80%) in anthropogenic aerosols and their precursors projected by Representative Concentration Pathway (RCP) 4.5 result in ~1 °C of additional warming and ~0.1 mm day −1 of additional precipitation, both globally averaged, by the end of the 21st century. The impact of these reductions in aerosol emissions on simulated global mean surface temperature and precipitation becomes apparent by mid‐21st century. Furthermore, we find that the aerosol emission reductions cause precipitation to increase in East and South Asia by ~1.0 mm day −1 through the second half of the 21st century. Both the temperature and the precipitation responses simulated by CM3 are significantly stronger than the responses previously simulated by our earlier climate model (CM2.1) that only considered direct radiative forcing by aerosols. We conclude that the indirect effects of sulfate aerosol greatly enhance the impacts of aerosols on surface temperature in CM3; both direct and indirect effects from sulfate aerosols dominate the strong precipitation response, possibly with a small contribution from carbonaceous aerosols. Just as we found with the previous GFDL model, CM3 produces surface warming patterns that are uncorrelated with the spatial distribution of 21st century changes in aerosol loading. However, the largest precipitation increases in CM3 are colocated with the region of greatest aerosol decrease, in and downwind of Asia. , Key Points Aerosol reductions (RCP4.5) cause 1K warming and +0.1 mm/day of precipitation. Sulfate indirect effects greatly enhance aerosol impacts on surface temperature. Aerosol reductions increase precipitation in Asia by 0.5–1.0 mm/day by 2100.

Thermal Equilibrium of the Atmosphere with a Given Distribution of Relative Humidity
Abstract Radiative convective equilibrium of the atmosphere with a given distribution of relative humidity is computed as the asymptotic state of an initial value problem. The results show that it takes almost twice as long to reach the state of radiative convective equilibrium for the atmosphere with a given distribution of relative humidity than for the atmosphere with a given distribution of absolute humidity. Also, the surface equilibrium temperature of the former is almost twice as sensitive to change of various factors such as solar constant, CO2 content, O3 content, and cloudiness, than that of the latter, due to the adjustment of water vapor content to the temperature variation of the atmosphere. According to our estimate, a doubling of the CO2 content in the atmosphere has the effect of raising the temperature of the atmosphere (whose relative humidity is fixed) by about 2C. Our model does not have the extreme sensitivity of atmospheric temperature to changes of CO2 content which was adduced by Möller.

Extreme CO2 levels could trigger clouds ‘tipping point’ and 8C of global warming
If atmospheric CO2 levels exceed 1,200 parts per million (ppm), it could push the Earth’s climate over a “tipping point”, finds a new study. This would see clouds that shade large part of the oceans start to break up.

A recent doubling of global warming rate signals a 1.5 °C breach by 2028
Timely and accurate projections of when global warming will exceed the Paris Agreement’s 1.5 °C threshold are essential for effective climate policy. Existing estimates place this exceedance in the early 2030 s but carry substantial uncertainty. Here we analyze the latest observational temperature records through 2025 and identify a statistically significant doubling of the global warming rate during 2011–2025 (0.40 °C per decade) compared to 1971–2025 (0.20 °C per decade). Extrapolating this accelerated rate projects a crossing of the 1.5 °C threshold by 2028, nearly a decade earlier than previous estimates. Regional analyses attribute this acceleration primarily to intensified warming over East Asia–the North Pacific, mid-latitude Eurasia, and the South Atlantic–Antarctic regions. The ensemble mean of 26 climate models fails to capture the observed doubling of the warming rate, simulating a rate of only 0.29 °C per decade. These findings suggest a narrower window remains to limit warming to 1.5 °C, underscoring the urgency for rapid and substantial reductions in greenhouse gas emissions.
Formation of the North Atlantic Warming Hole by reducing anthropogenic sulphate aerosols
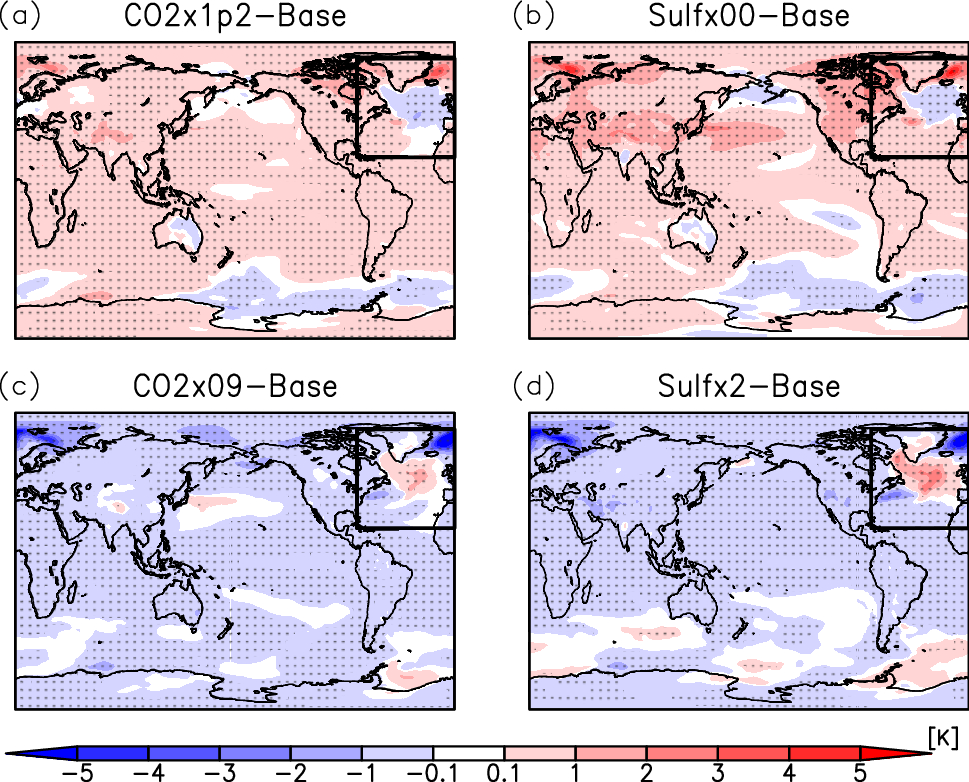
The North Atlantic Warming Hole (NAWH) has been observed and predicted due to the increase in carbon dioxide (CO2) concentration. If sulphate aerosols, which have a cooling effect on the atmosphere, are reduced by air pollution control, the NAWH may form as it would if CO2 concentrations increased. In this study, sensitivity experiments using a coupled atmosphere–ocean-aerosol model were conducted by varying the amount of sulphur dioxide (SO2) emissions, a precursor of sulphate which is the primary anthropogenic aerosol in the atmosphere, to analyse the changes in the ocean temperature, salinity, and density. The results showed that although the spatial patterns of the NAWH due to the changes in SO2 emissions was similar to that due to the changes in the CO2 concentrations, the magnitude of the shifts in the ocean parameters due to the changes in SO2 emissions is larger even when changes in global mean temperature are comparable. This can be due to the spatial concentration of sulphate aerosols in the mid-latitudes of the Northern Hemisphere, resulting larger changes in the heat transport from the south on the Gulf Stream and the North Atlantic Current along with changes in freshwater inflow from the Arctic through the Labrador Sea.
A Revelation About Trees Is Messing With Climate Calculations
Trees make clouds by releasing small quantities of vapors called “sesquiterpenes.” Scientists are learning more—and it’s making climate models hazy.
Flying is worse for the climate than you think
RETRACTED ARTICLE: The economic commitment of climate change
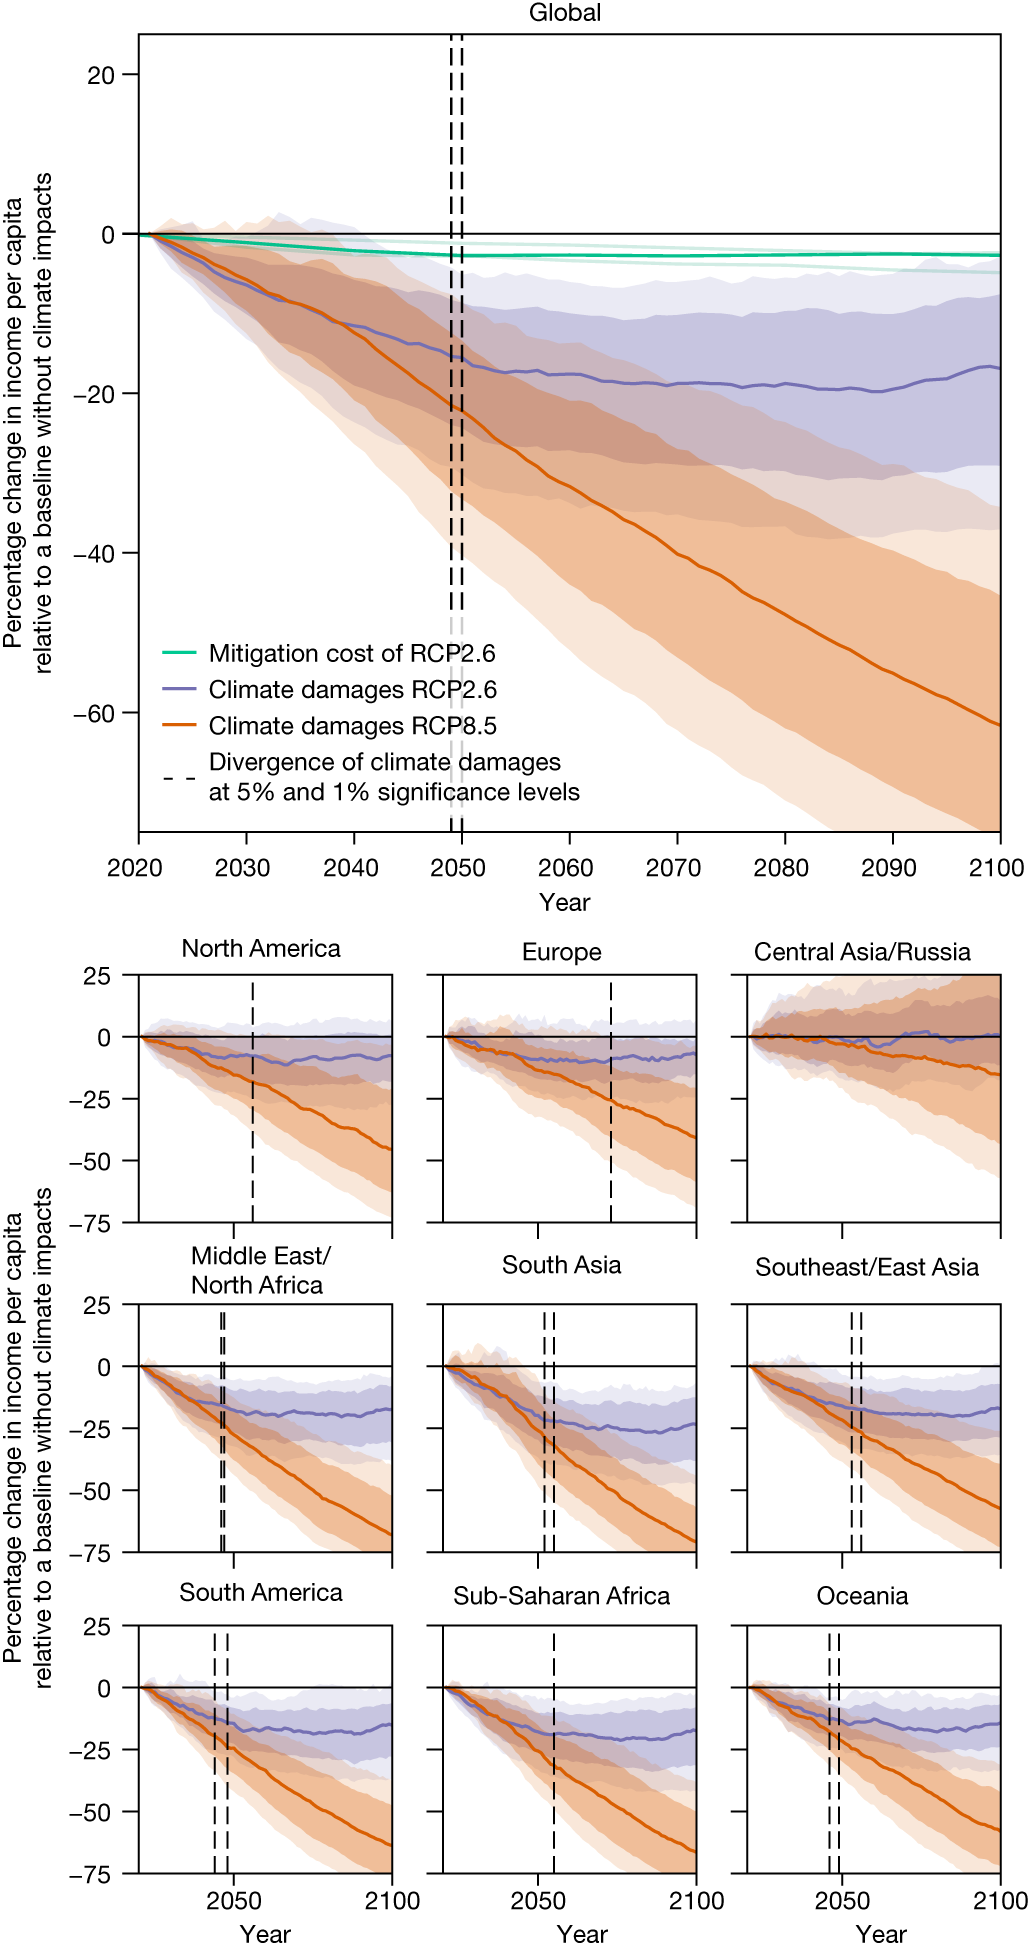
Global projections of macroeconomic climate-change damages typically consider impacts from average annual and national temperatures over long time horizons1–6. Here we use recent empirical findings from more than 1,600 regions worldwide over the past 40 years to project sub-national damages from temperature and precipitation, including daily variability and extremes7,8. Using an empirical approach that provides a robust lower bound on the persistence of impacts on economic growth, we find that the world economy is committed to an income reduction of 19% within the next 26 years independent of future emission choices (relative to a baseline without climate impacts, likely range of 11–29% accounting for physical climate and empirical uncertainty). These damages already outweigh the mitigation costs required to limit global warming to 2 °C by sixfold over this near-term time frame and thereafter diverge strongly dependent on emission choices. Committed damages arise predominantly through changes in average temperature, but accounting for further climatic components raises estimates by approximately 50% and leads to stronger regional heterogeneity. Committed losses are projected for all regions except those at very high latitudes, at which reductions in temperature variability bring benefits. The largest losses are committed at lower latitudes in regions with lower cumulative historical emissions and lower present-day income.
COVID-19 lockdowns temporarily raised global temperatures, research shows
The lockdowns and reduced societal activity related to the COVID-19 pandemic affected emissions of pollutants in ways that slightly warmed the planet for several months last year, according to new research. The counterintuitive finding highlights the influence of airborne particles, or aerosols, that block incoming sunlight.

Upper ocean temperatures hit record high in 2020
Even with the small COVID-19-related dip in global carbon emissions due to limited travel and other activities, the ocean temperatures continued a trend of breaking records in 2020. A new study, authored ...

ATmosphereConf 2026 Is Not Over | Offprint
A not-retrospective of ATmosphereConf 2026

Computational Education Commons on the Atmosphere - ATmosphereConf 2026
Pointing at the wider atmosphere A few small updates since the last post. cc @renderg.host @riad.blog skypress.blog/@skypress.blog/its-always-sun…

Pointing at the wider atmosphere
skypress.blog