

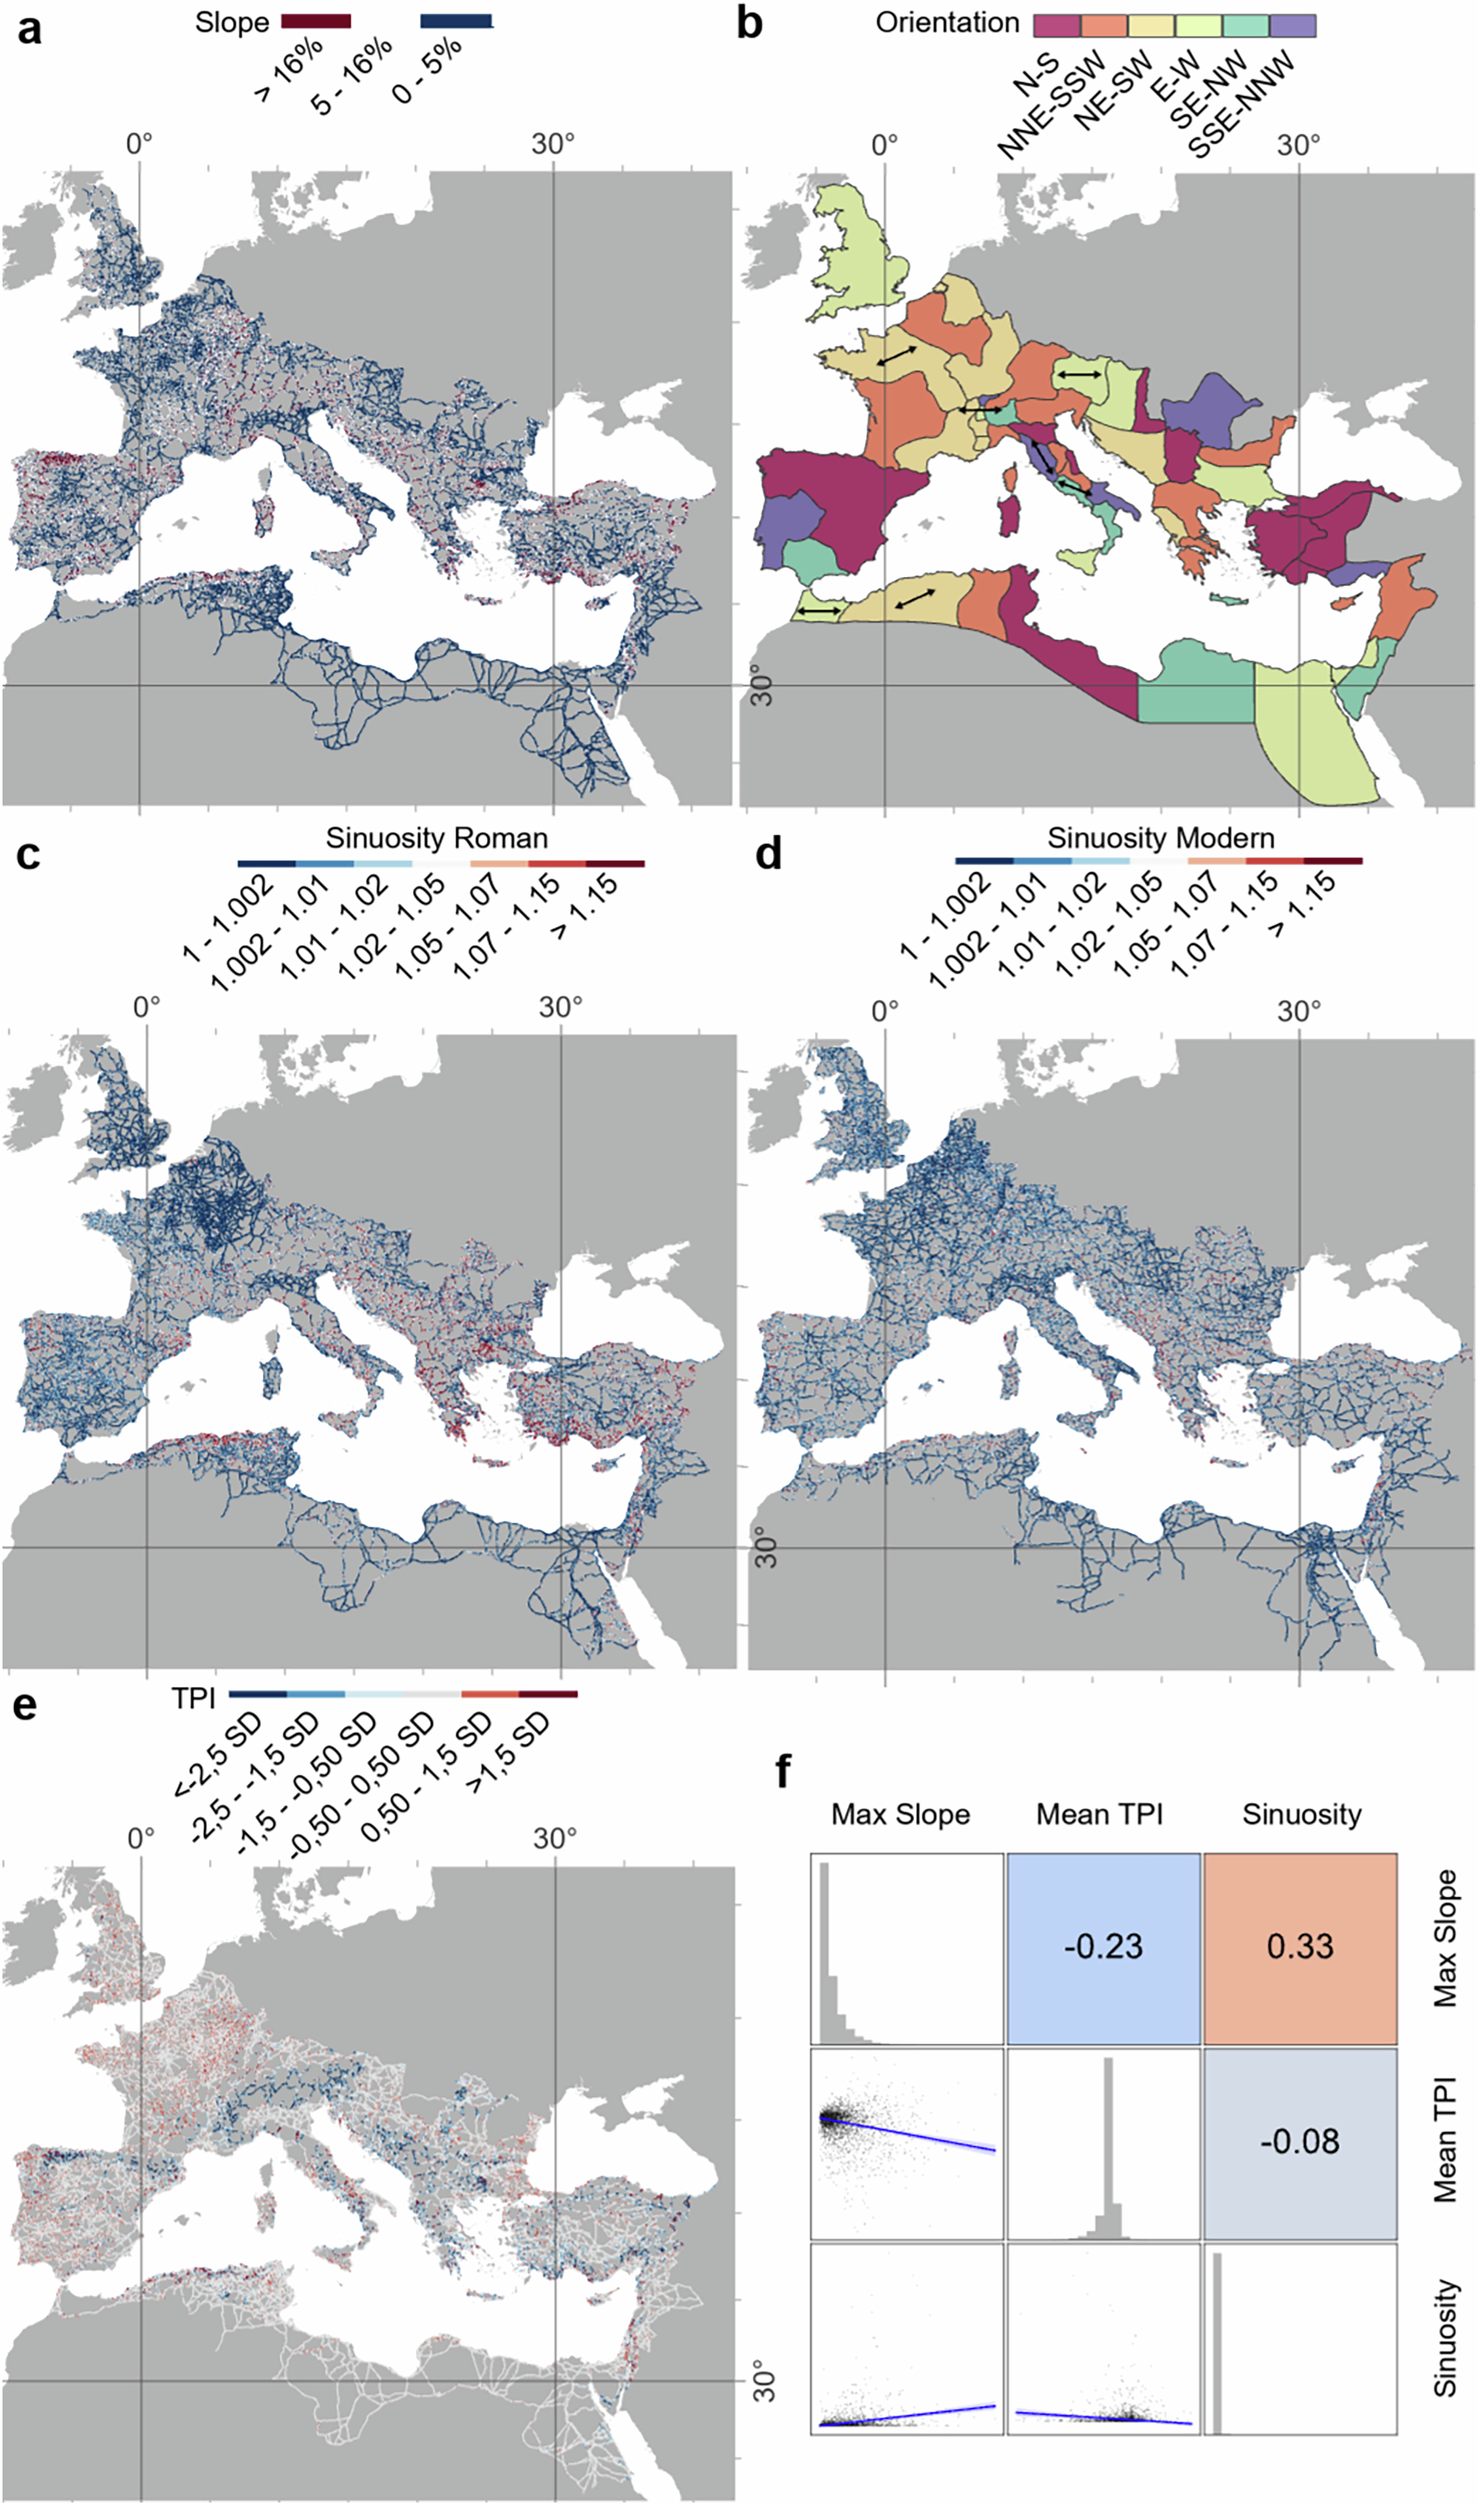
Ancient infrastructure can leave lasting imprints on modern settlement patterns and mobility. The Roman road network connected vast regions of Europe, North Africa, and the Middle East, and is often mentioned as an example of such long-term impact. Yet its structural characteristics remain largely unquantified. Here we present a high spatial resolution quantitative exploratory analysis of the Roman Empire’s road system, enabled by our creation of a spatially detailed Empire-wide dataset. We address long-standing questions concerning the straightness and persistence of these roads, and the centrality of cities like Rome. We show that Roman roads tend to be straight where topography allows but less so than modern roads; provincial capitals were more centrally located than other cities for mediating terrestrial mobility; segments hypothesised to be main roads were more important intermediaries than secondary roads; and Roman road density correlates with major modern roads.
Rome2Rio
Discover how to get anywhere by searching plane, train, bus, car and ferry routes

Calculating Empires: A Genealogy of Technology and Power since 1500
Explore how technical and social structures co-evolved over five centuries in this large-scale research visualization.
Reinventing Explanation
The Babylonian Map of the World is one of the world's oldest extant maps, dating to 600 BCE. It's a crude map, difficult to read at a glance, but fortunately an accompanying cuneiform text describes the features on the map, including Babylon, seven other cities, a canal, and a mountain: Modern maps are, of course, far better than this early map. They improve on it by taking advantage of the many map-making techniques developed since 600 BCE, such as: surveying to get proportions correct; projections to correct for the curvature of the Earth; methods to depict topographic features; and so on. Even ideas such as showing roads and nautical routes were not a priori obvious, but had to be invented.
A City Is Not a Computer: Other Urban Intelligences
<strong>A bold reassessment of "smart cities" that reveals what is lost when we conceive of our urban spaces as computers</strong> Computational models of urbanism—smart cities that use data-driven planning and algorithmic administration—promise to deliver new urban efficiencies and conveniences. Yet these models limit our understanding of what we can know about a city. <i>A City Is Not a Computer</i> reveals how cities encompass myriad forms of local and indigenous intelligences and knowledge institutions, arguing that these resources are a vital supplement and corrective to increasingly prevalent algorithmic models. Shannon Mattern begins by examining the ethical and ontological implications of urban technologies and computational models, discussing how they shape and in many cases profoundly limit our engagement with cities. She looks at the methods and underlying assumptions of data-driven urbanism, and demonstrates how the "city-as-computer" metaphor, which undergirds much of today's urban policy and design, reduces place-based knowledge to information processing. Mattern then imagines how we might sustain institutions and infrastructures that constitute more diverse, open, inclusive urban forms. She shows how the public library functions as a steward of urban intelligence, and describes the scales of upkeep needed to sustain a city's many moving parts, from spinning hard drives to bridge repairs. Incorporating insights from urban studies, data science, and media and information studies, <i>A City Is Not a Computer</i> offers a visionary new approach to urban planning and design.
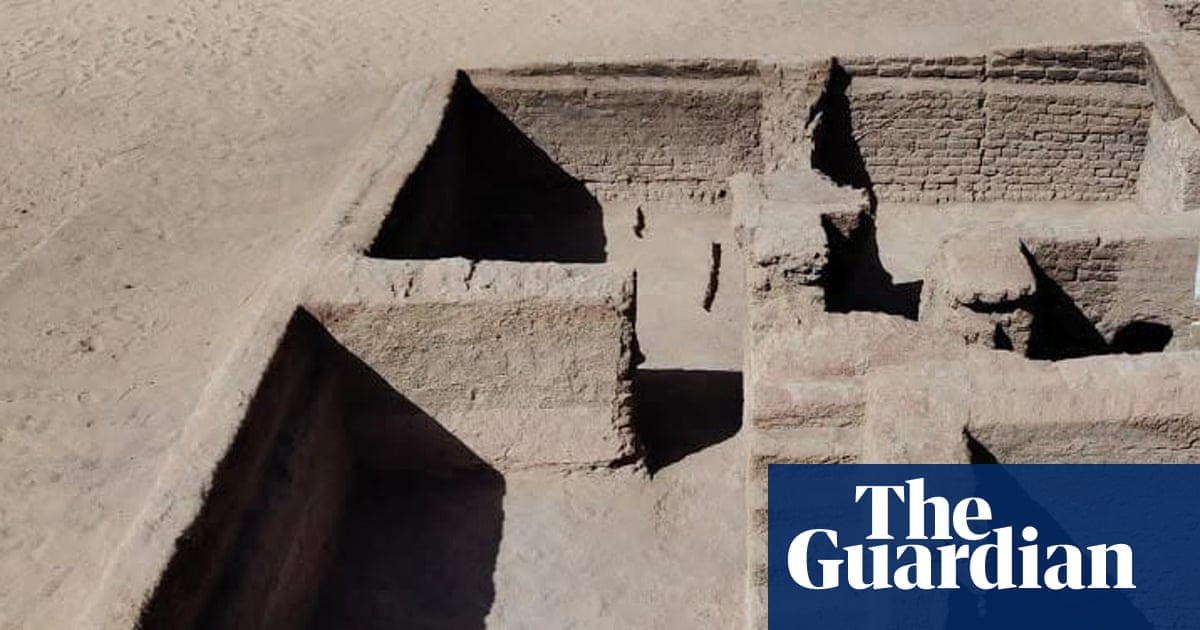
Archaeologists uncover ancient Byzantine city in Egypt’s western desert
Well-preserved fourth-century quarters reveal details of daily life, urban development and economic activities
Transit System Route Map, 1979

Where Does Community Live? - some responses - Connected Places
I agree that the architecture of a space matters, but I'm not sure the extent we agree as to how much a protocol really matters, versus what we build with them. Roundabout is built on atproto, and I'm quite happy with the decision. I think our architecture very strongly supports our communities.
Procedural river or road generation for infinite terrain
I should say paths, not roads as I'm thinking more medieval-like. Also, not looking for realism. The answer I'm looking for will be to fit into the mold I describe rather than realism. I am lookin...

Exploring Rectangle Subdivisions
Last week, I saw a talk on Vuntra City, a procedurally generated city with a fully explorable city. Developer Larissa Davidova explained that she settled on using Recursive Subdivision for the city…

Planning for isolation? The role of urban form and function in shaping mobility in Brasilia
Brasília offers a rare test of how urban form shapes experienced segregation. Built almost at once around modernist neighbourhood units, then expanded through planned satellites and informal peripheries, it lets us ask whether urban form turns mobility into mixing or into a more efficient engine of separation. We combine data on human mobility with urban morphometrics, amenities, road networks, along with enclosures and tessellations that capture segregation at the scales where access is structured: districts, neighbourhoods, blocks, and street-and-building cells. We find that segregation intensifies as resolution sharpens, from 0.282 at the district scale to 0.545 at the block scale, indicating that Brasília looks most integrated at coarse units and most segregated where everyday encounters are actually organised. Mobility softens home segregation for most users, but not symmetrically: poorer groups travel farther, while affluent groups remain the most selectively exposed. civic cores and mid-rise, mixed-use areas are the least segregated morphotypes, yet they occupy only a sliver of the metropolis. Elsewhere, rich lakefront suburbs and dense poor settlements reach similarly high segregation through opposite spatial logics. Amenities predict lower segregation, while barriers and enclosed residential interiors predict higher segregation. Built form explains more of this pattern than visit volume alone in the segregation models: integration is less a property of residential design than of shared destinations and porous connections. Planned capitals can build order without building isolation if they distribute mixing space rather than sequestering it.

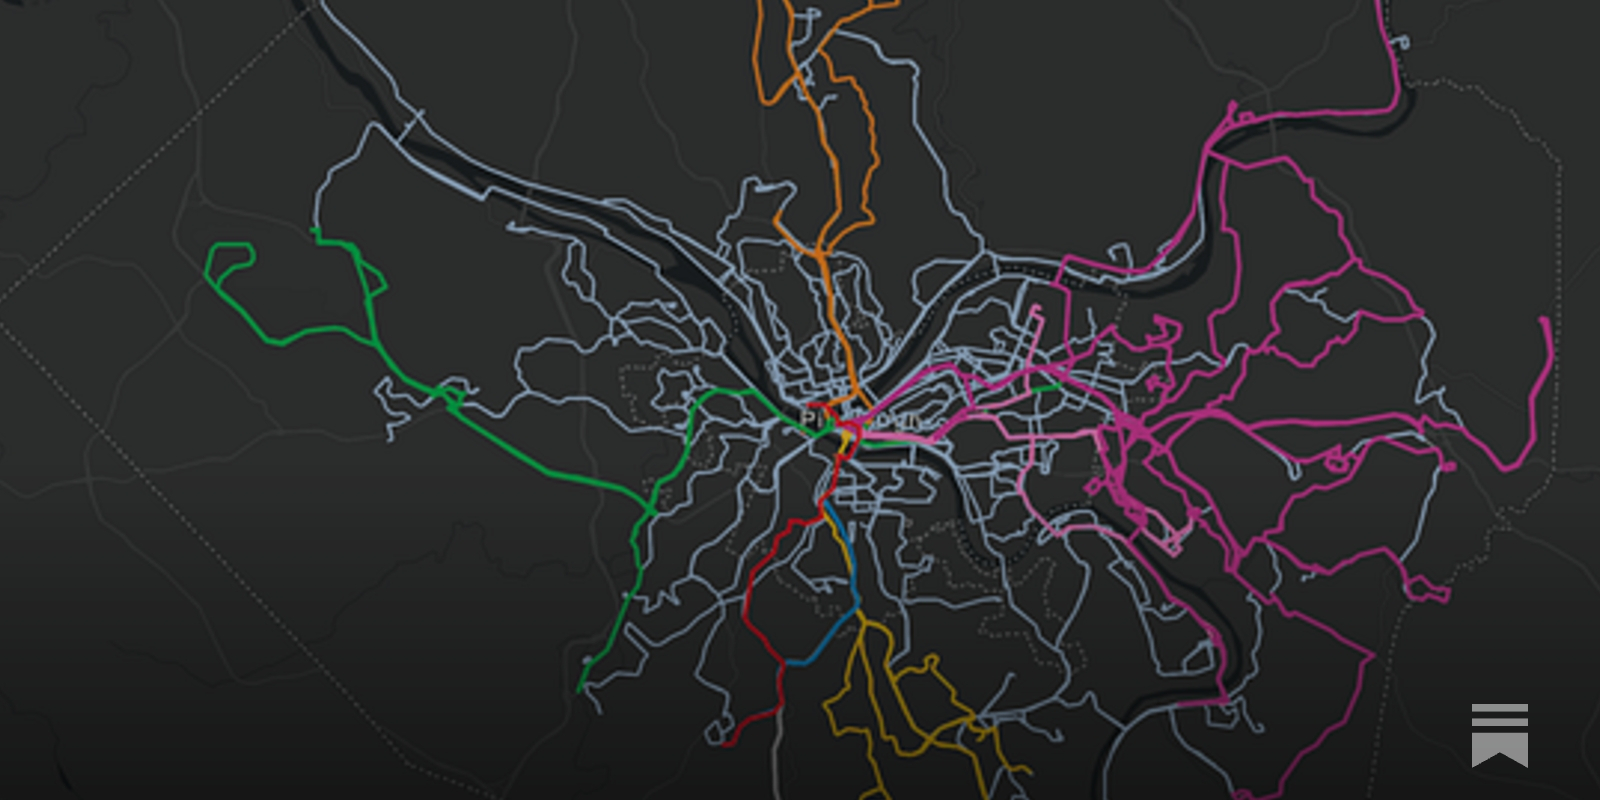
The Real Transit Map
Just because a route is on the map doesn’t mean that it’s useful.
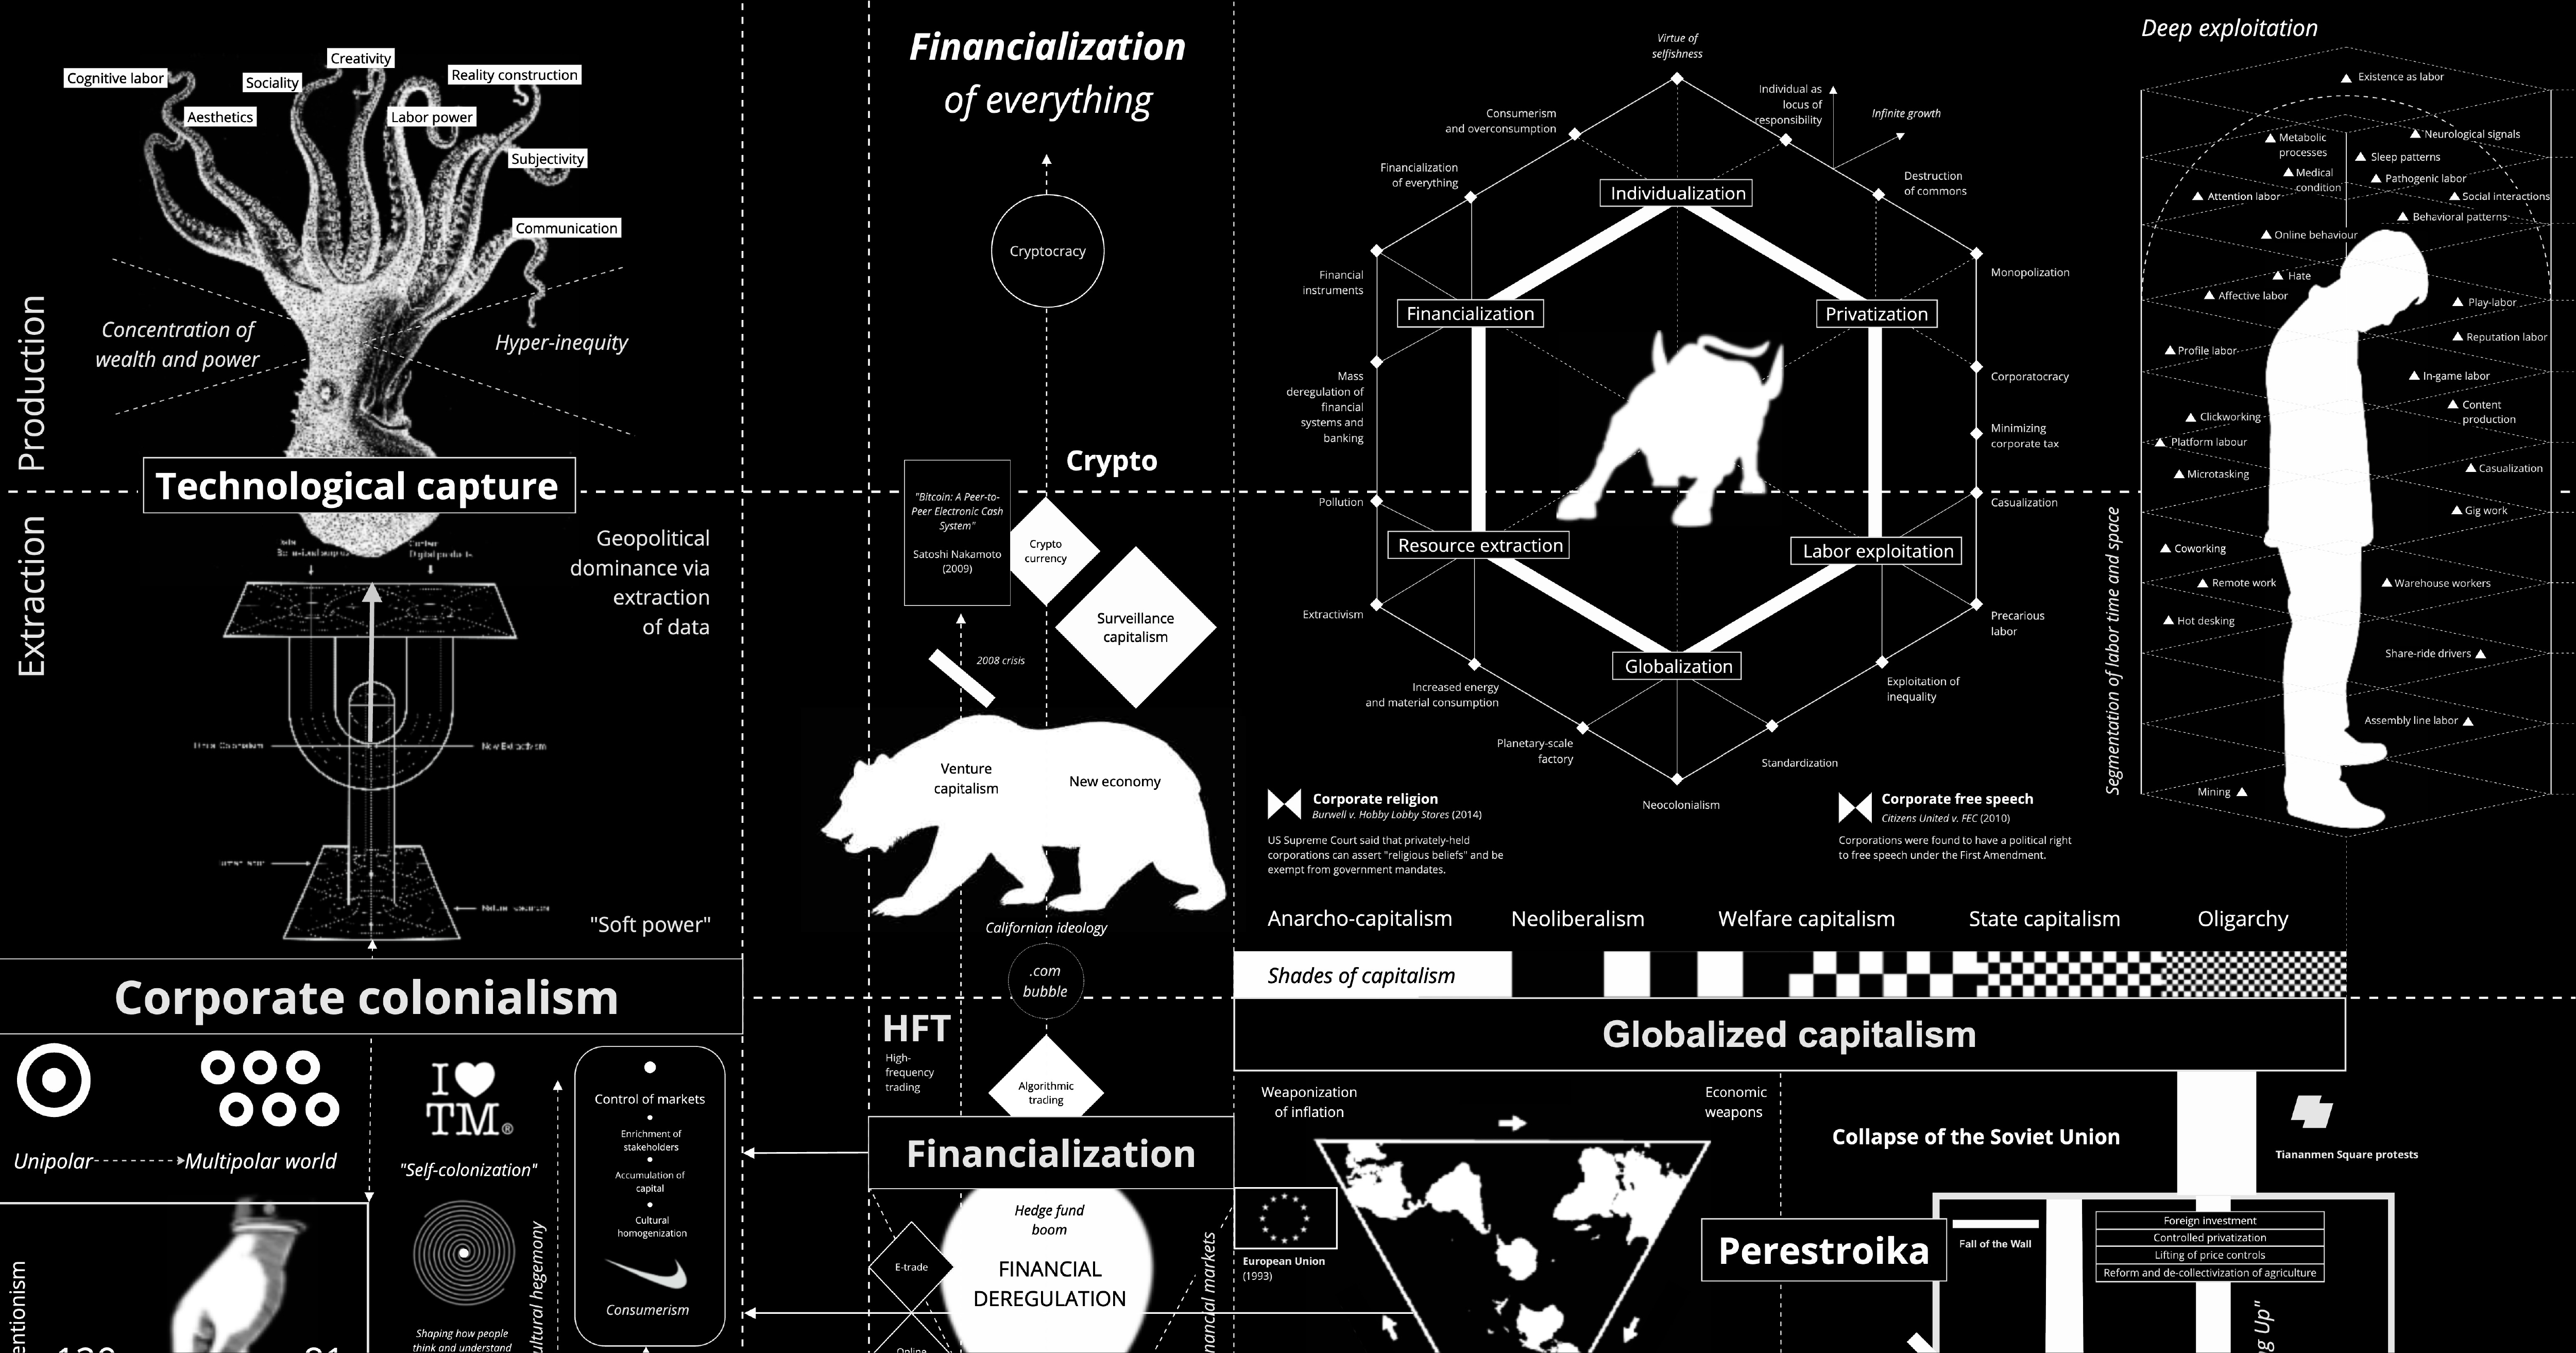
Capitalism Tech Stack Map — A Cross-Civilization Infographic (D3 Force)
Urban congestion relief experiments through routing-app interventions
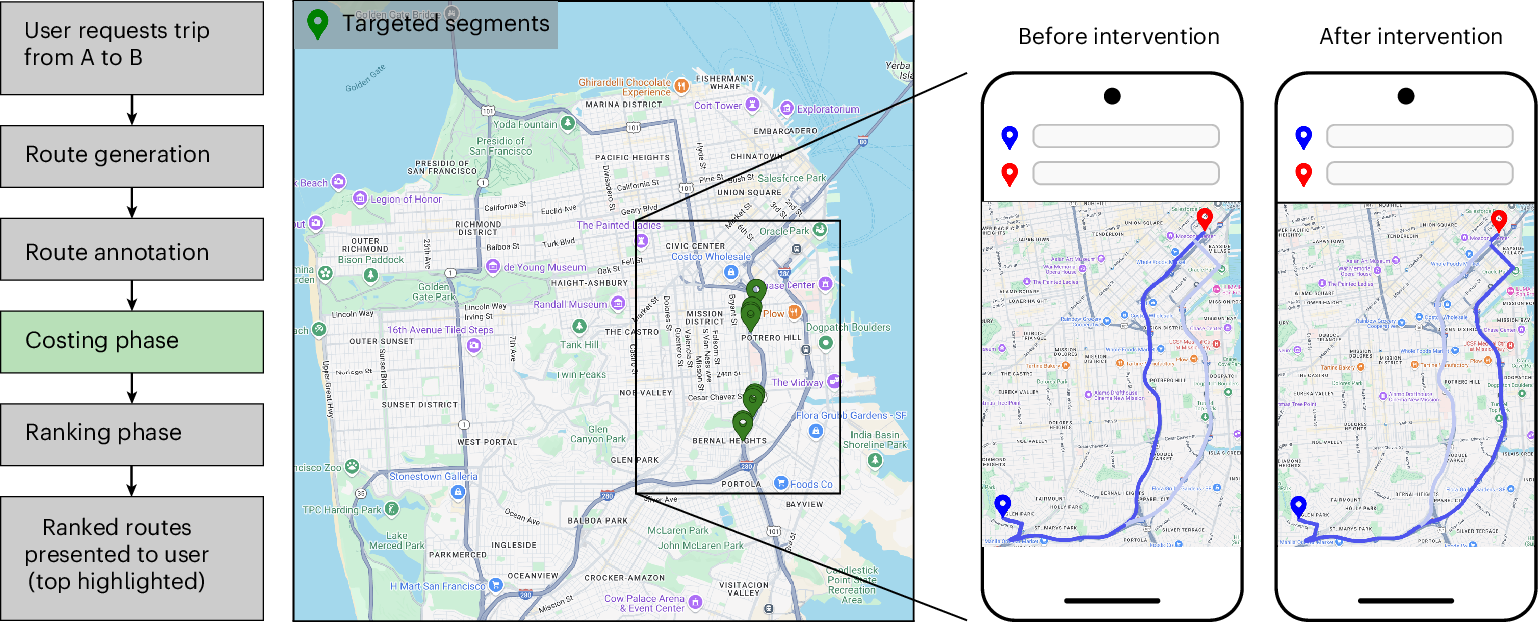
Traffic congestion remains a persistent challenge for urban mobility, increasing travel delays and elevating CO2 emissions. The widespread use of smartphones and GPS navigation creates new opportunities to mitigate congestion through routing optimizations in apps, yet real-world evidence for the effectiveness of such interventions is limited. Here we report large-scale empirical experiments evaluating routing-based traffic interventions on ~100 highly congested road segments across 10 major US cities. By rerouting a small share of Google Maps trips from targeted congested highway and arterial segments to less congested alternatives of equivalent road-classes with comparable travel times, we observe a city-average 2% increase in vehicle speeds on the intervened segments, along with improved travel times 0.7% and potential annual reductions exceeding 1,000 tons of CO2-equivalent emissions per city in the majority of studied locations. These findings provide evidence that marginal routing interventions involving a small proportion of vehicles can measurably enhance overall road network efficiency, offering a practical pathway to easing congestion and advancing urban sustainability.
Intranational International Boulevard: A Street's Atlas - Oakland - LocalWiki
The Intranational International Boulevard: A Street's Atlas is a cool mapping project done by students in the UC Berkeley’s Cartography and GIS Education (CAGE) Lab. It maps International Blvd. in a variety of hyper-local ways.
Yohan on Twitter / X
For six months, Google Maps sent a slice of drivers in ten American cities down deliberately slower routes.About 30 seconds slower on average, and under 2% of trips were touched. The experiment ran on roughly 100 of the most congested road segments in each city, switching on… pic.twitter.com/5cshNdmWU2— Yohan (@yohaniddawela) August 28, 2026

National Zoning Atlas
The National Zoning Atlas is digitizing, demystifying, and democratizing information about zoning conditions in more than 33,000 jurisdictions in the U.S. — empowering advocates, revealing insights, and driving research.
