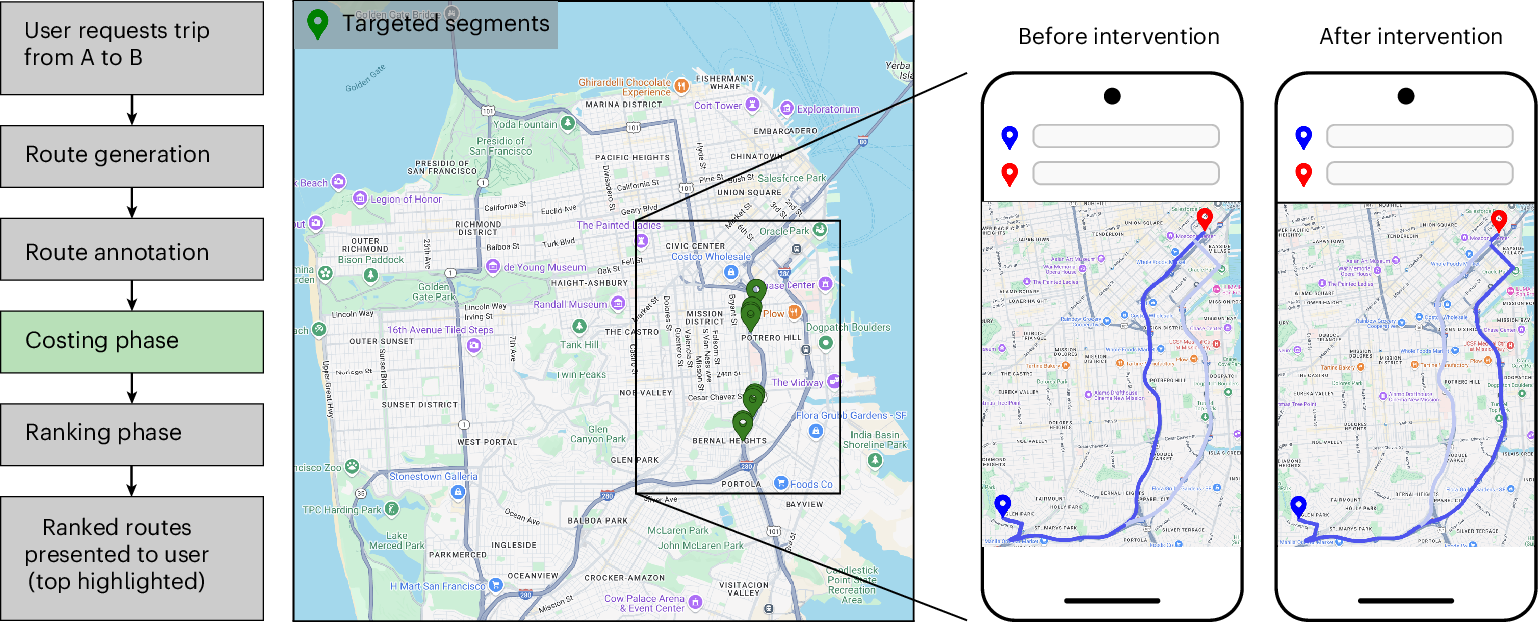
Traffic congestion remains a persistent challenge for urban mobility, increasing travel delays and elevating CO2 emissions. The widespread use of smartphones and GPS navigation creates new opportunities to mitigate congestion through routing optimizations in apps, yet real-world evidence for the effectiveness of such interventions is limited. Here we report large-scale empirical experiments evaluating routing-based traffic interventions on ~100 highly congested road segments across 10 major US cities. By rerouting a small share of Google Maps trips from targeted congested highway and arterial segments to less congested alternatives of equivalent road-classes with comparable travel times, we observe a city-average 2% increase in vehicle speeds on the intervened segments, along with improved travel times 0.7% and potential annual reductions exceeding 1,000 tons of CO2-equivalent emissions per city in the majority of studied locations. These findings provide evidence that marginal routing interventions involving a small proportion of vehicles can measurably enhance overall road network efficiency, offering a practical pathway to easing congestion and advancing urban sustainability.
Yohan on Twitter / X
For six months, Google Maps sent a slice of drivers in ten American cities down deliberately slower routes.About 30 seconds slower on average, and under 2% of trips were touched. The experiment ran on roughly 100 of the most congested road segments in each city, switching on… pic.twitter.com/5cshNdmWU2— Yohan (@yohaniddawela) August 28, 2026

Cycling Toward a Cooler Toronto | The Power of Bike Lanes
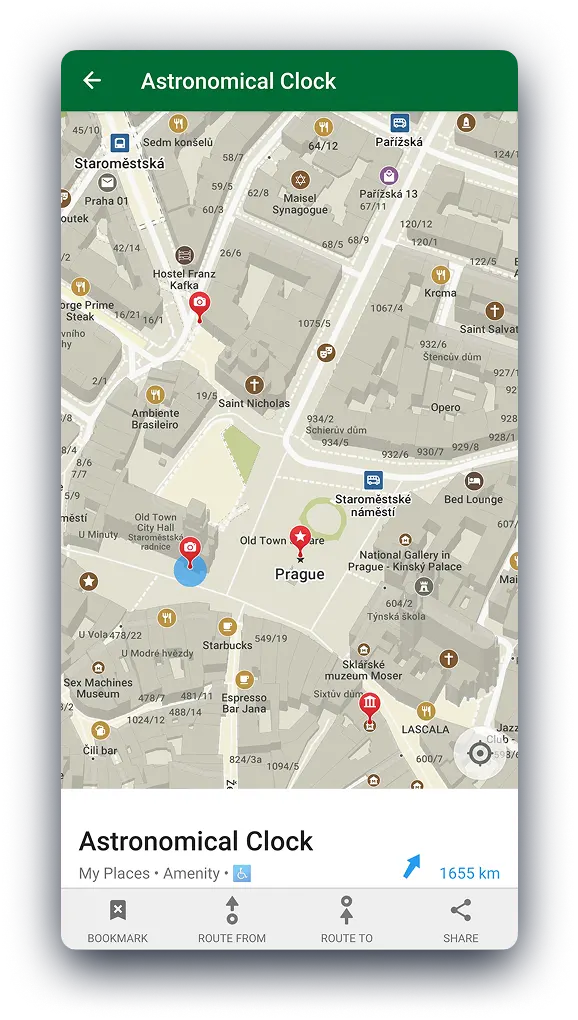
Hike, Bike, Drive Offline – Navigate with Privacy
Discover more of your journey - Powered by the community
The Real Transit Map
Just because a route is on the map doesn’t mean that it’s useful.
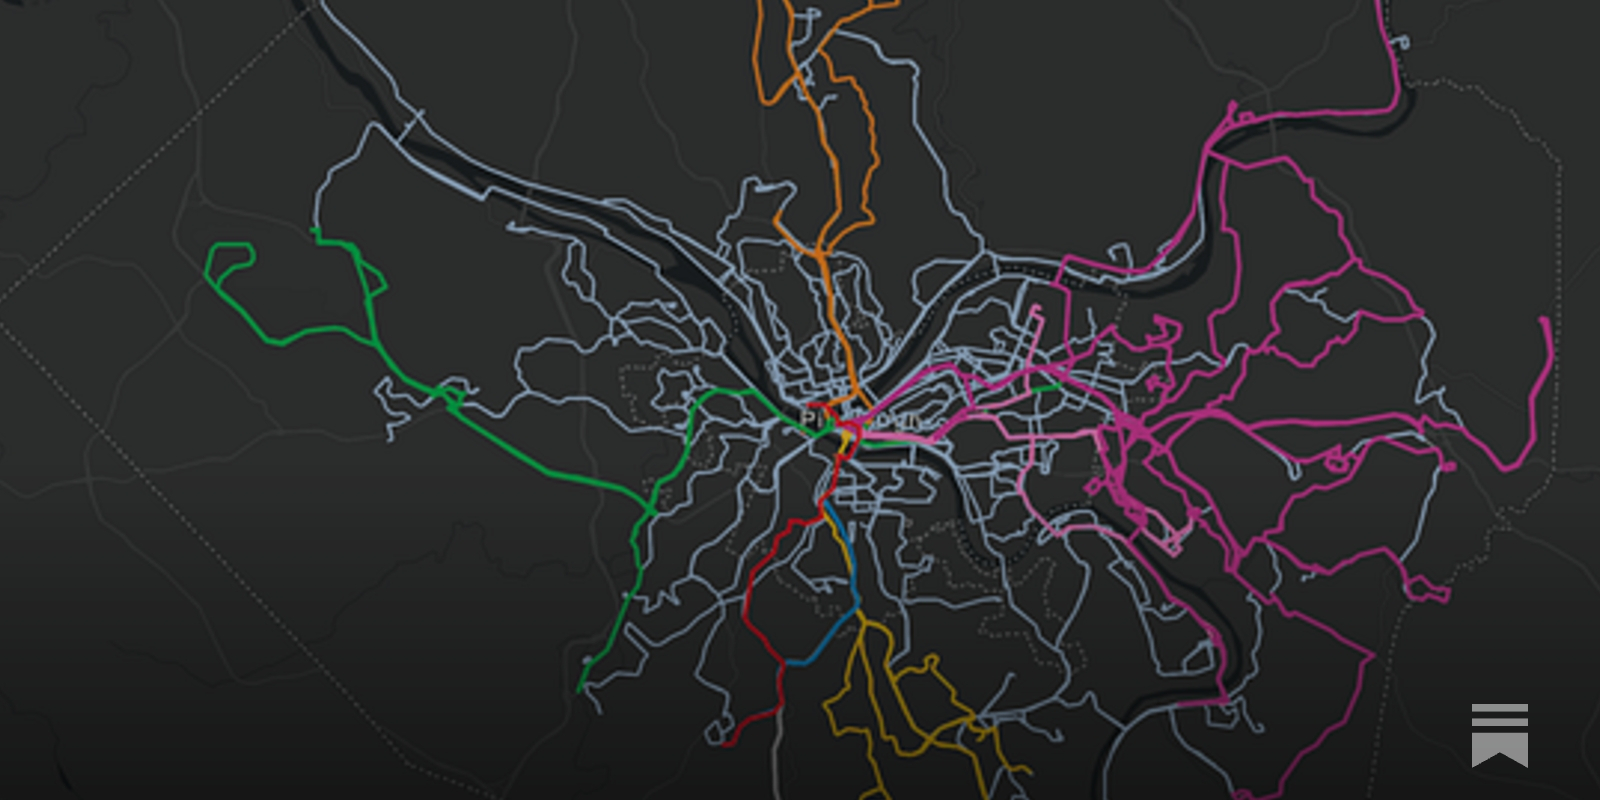
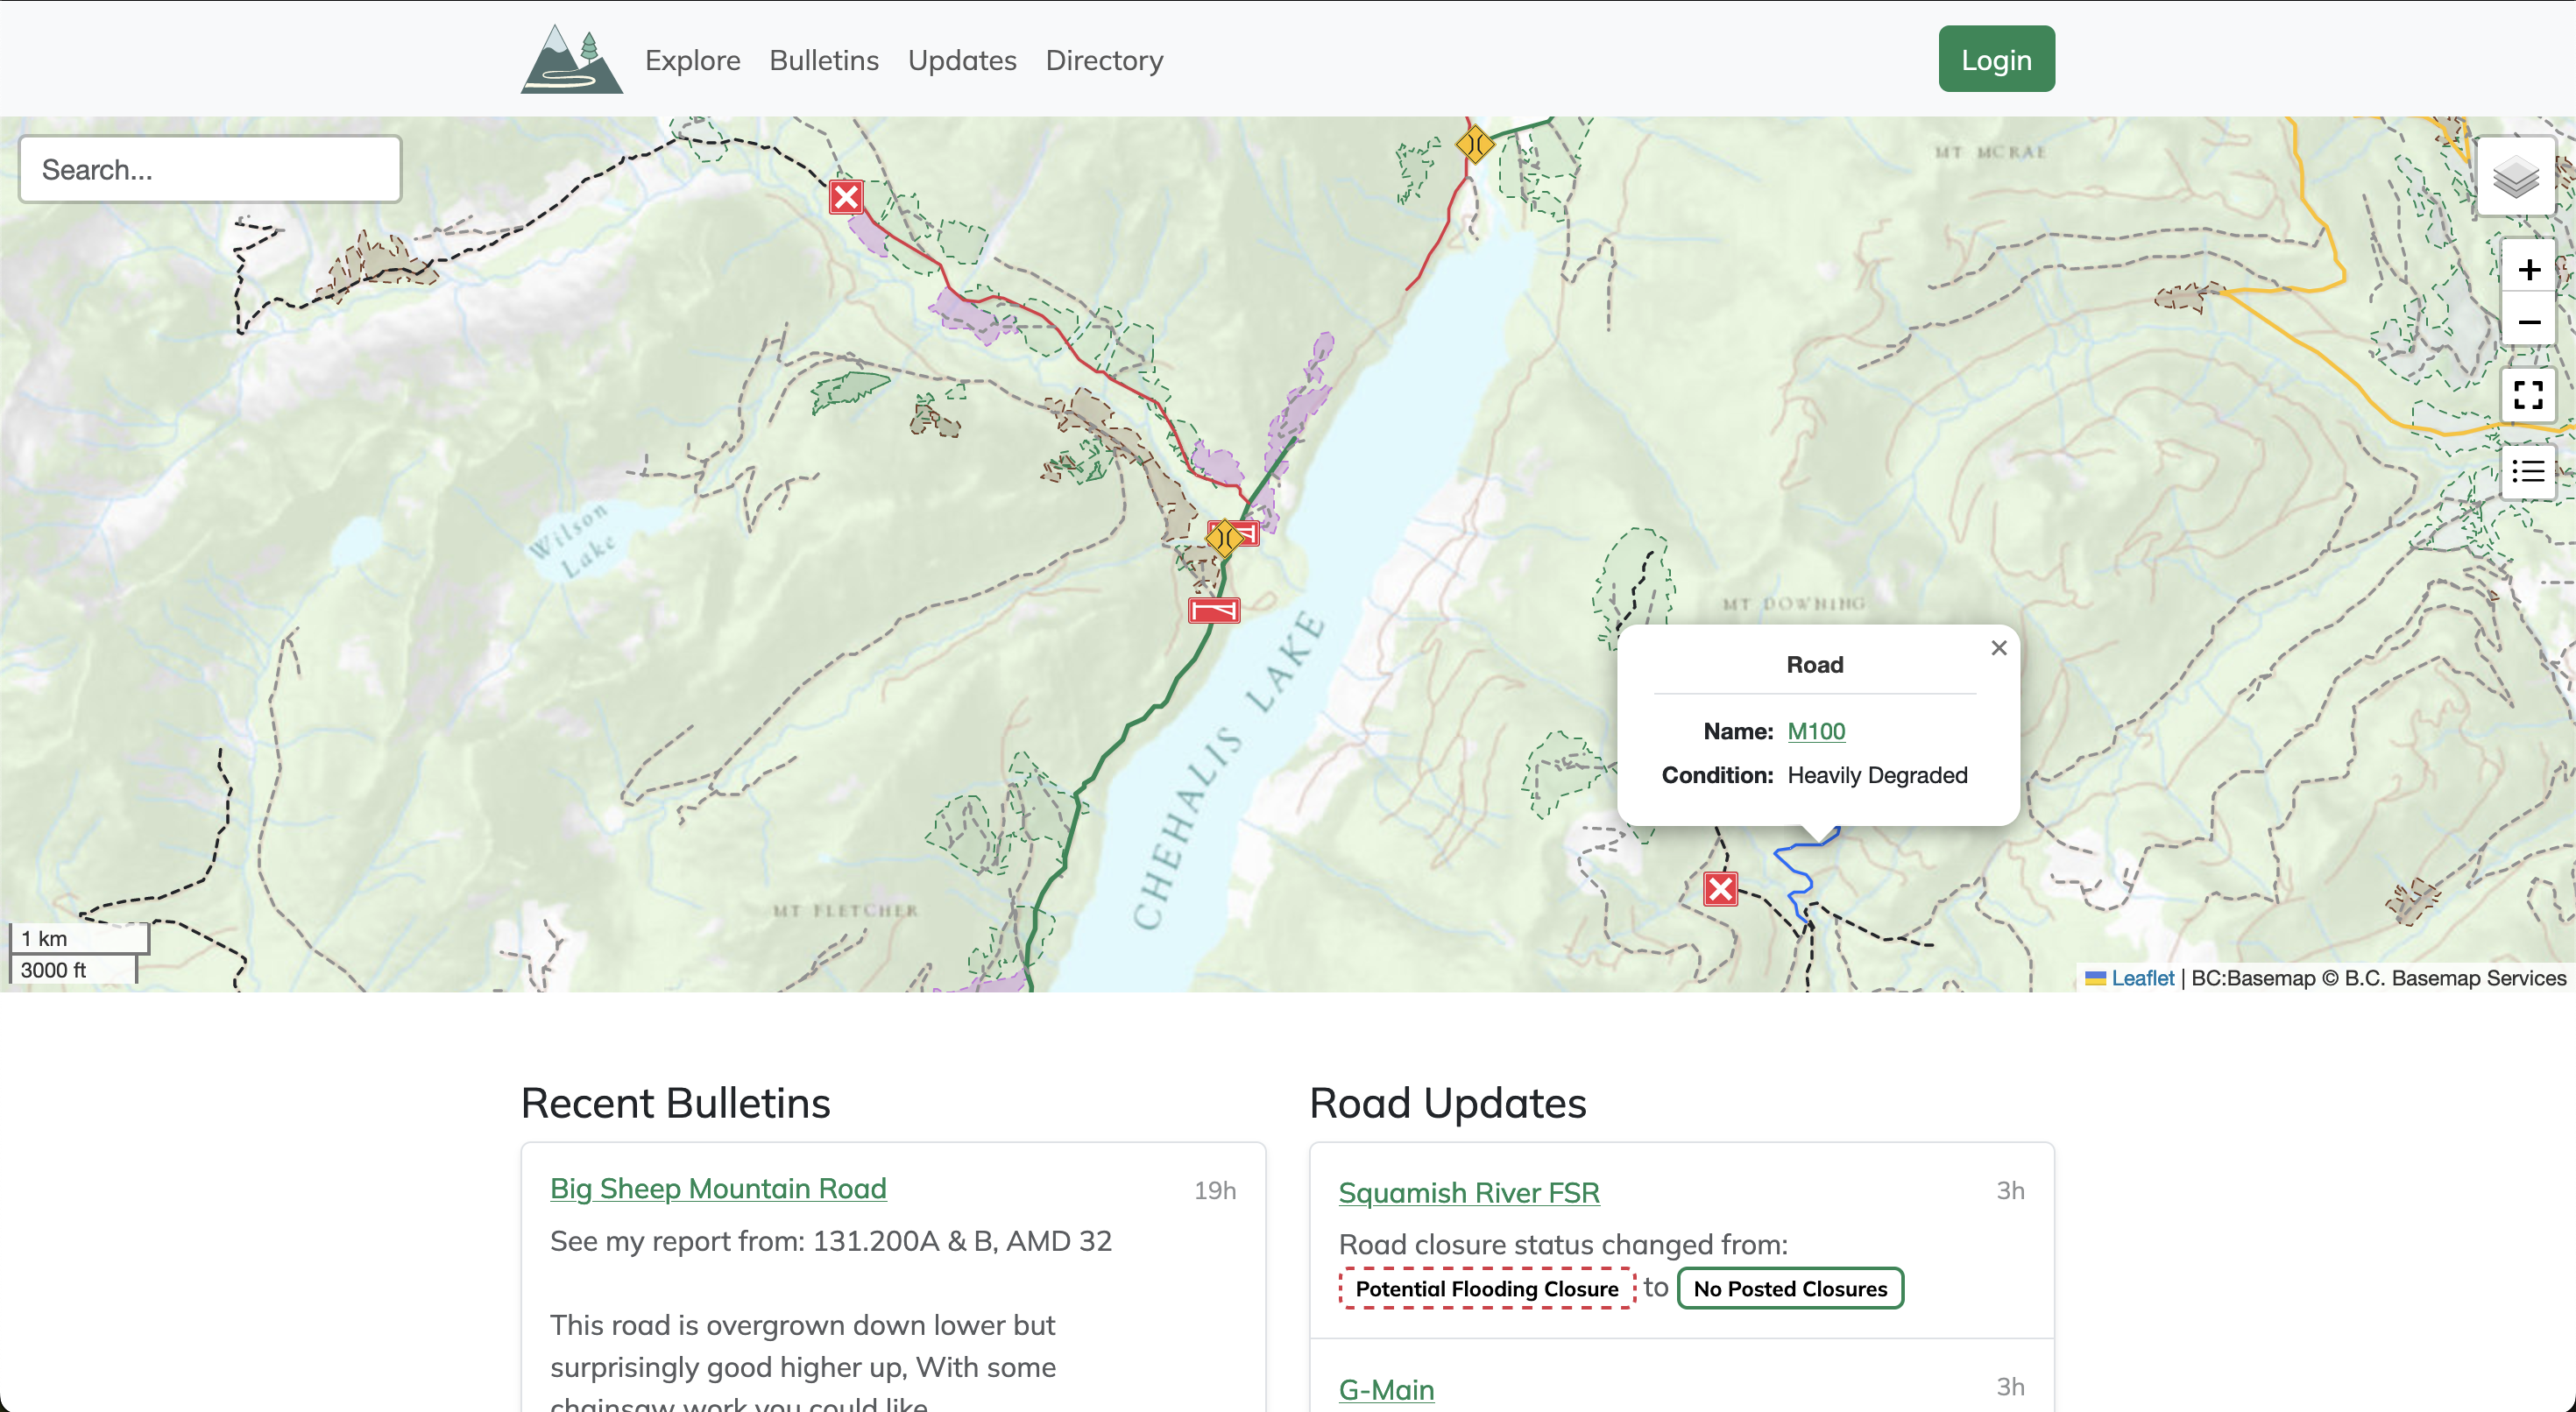
Service Road Atlas
Service roads are an integral part of accessing the wilderness, but they're constantly changing over time. Use the Service Road Atlas to find the latest community driven updates on the roads you wish to access.
The cost of driving versus using a bike and transit (or: how to save over $7,000 a year)
I thought it would be fun to find out: how much money did I save in 2025 by cycling and using transit compared to using a car as my primary way of getting around?


The power of collaboration: How we can reduce traffic congestion
Neha Arora and Aboudy Kreidieh, Software Engineers, Google Research

Three Lane Highway news & Reviews | PC Gamer
The latest Three Lane Highway news and reviews
Reducing car dependence: benefits, strategies, unintended consequences, and future directions of post-car urban transitions
This paper presents the state of the art of post-car urban transitions. It begins with an overview of the impact of automobility on planetary and human well-being. The benefits of post-car cities a...

Paris said au revoir to cars. Air pollution maps reveal a dramatic change.
Air pollution fell substantially as the city restricted car traffic and made way for parks and bike lanes.

How Google Maps quietly allocates survival across London’s restaurants - and how I built a dashboard to see through it
I wanted a dinner recommendation and got a research agenda instead. Using 13000+ restaurants, I rebuild its ratings with machine learning and map how algorithmic visibility actually distributes power.
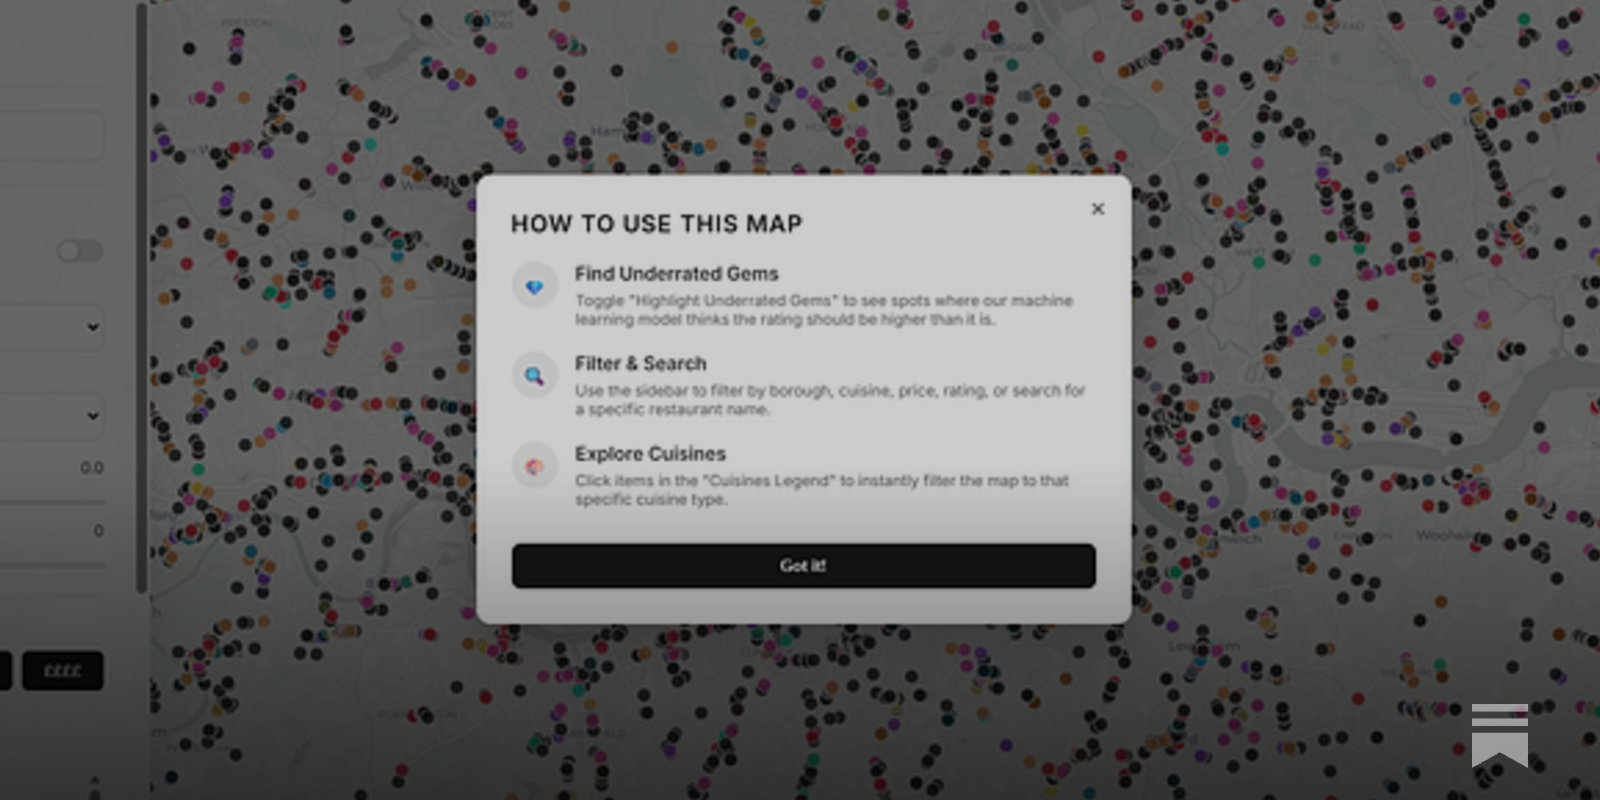
How Google Maps quietly allocates survival across London’s restaurants - and how I built a dashboard to see through it
I wanted a dinner recommendation and got a research agenda instead. Using 13000+ restaurants, I rebuild its ratings with machine learning and map how algorithmic visibility actually distributes power.
How Google Maps quietly allocates survival across London’s restaurants - and how I built a dashboard to see through it
I wanted a dinner recommendation and got a research agenda instead. Using 13000+ restaurants, I rebuild its ratings with machine learning and map how algorithmic visibility actually distributes power.
How Google Maps quietly allocates survival across London’s restaurants - and how I built a dashboard to see through it
I wanted a dinner recommendation and got a research agenda instead. Using 13000+ restaurants, I rebuild its ratings with machine learning and map how algorithmic visibility actually distributes power.
Designing a wayfinding concept for Vancouver's Skytrain system.
I wasn’t always a big fan of public transport.