We estimate a measure of segregation, experienced isolation, that captures individuals’ exposure to diverse others in the places they visit over the course of their days. Using Global Positioning System (GPS) data collected from smartphones, we measure experienced isolation by race. We find that the isolation individuals experience is substantially lower than standard residential isolation measures would suggest, but that experienced and residential isolation are highly correlated across cities. Experienced isolation is lower relative to residential isolation in denser, wealthier, more educated cities with high levels of public transit use, and is also negatively correlated with income mobility.
Planning for isolation? The role of urban form and function in shaping mobility in Brasilia
Brasília offers a rare test of how urban form shapes experienced segregation. Built almost at once around modernist neighbourhood units, then expanded through planned satellites and informal peripheries, it lets us ask whether urban form turns mobility into mixing or into a more efficient engine of separation. We combine data on human mobility with urban morphometrics, amenities, road networks, along with enclosures and tessellations that capture segregation at the scales where access is structured: districts, neighbourhoods, blocks, and street-and-building cells. We find that segregation intensifies as resolution sharpens, from 0.282 at the district scale to 0.545 at the block scale, indicating that Brasília looks most integrated at coarse units and most segregated where everyday encounters are actually organised. Mobility softens home segregation for most users, but not symmetrically: poorer groups travel farther, while affluent groups remain the most selectively exposed. civic cores and mid-rise, mixed-use areas are the least segregated morphotypes, yet they occupy only a sliver of the metropolis. Elsewhere, rich lakefront suburbs and dense poor settlements reach similarly high segregation through opposite spatial logics. Amenities predict lower segregation, while barriers and enclosed residential interiors predict higher segregation. Built form explains more of this pattern than visit volume alone in the segregation models: integration is less a property of residential design than of shared destinations and porous connections. Planned capitals can build order without building isolation if they distribute mixing space rather than sequestering it.

Credit Access in the United States
We measure differences in US households’ access to credit and explore the mechanisms driving such differences using newly constructed population-level linked credit bureau and Census data. We find large differences in credit scores by race, class, and hometown that emerge in one’s 20s and persist throughout the life cycle. These gaps are primarily driven by differences in delinquencies that emerge in young adulthood. By age 30, 73% of Black individuals, 62% of those from low-income families, and 51% of those from Appalachia and the South have a 90+ day delinquency on their credit report, in contrast to 36% for White individuals, 20% for high-income families, and 31% for those from the upper Midwest. These delinquencies are correlated with income and wealth, but observed income profiles and wealth account for at most 10–35% of the gaps in delinquencies across groups. In contrast, movers-based estimates of hometown effects imply that childhood exposure accounts for around 50% of the differences in delinquencies across hometowns. Counties that promote repayment also promote upward income mobility, but adult income mediates only a small fraction of this relationship: growing up in a place where others are likely to repay improves credit outcomes even for those who do not have higher income in adulthood. We provide suggestive evidence on the mechanisms driving these patterns. JEL Codes: G5, H0.
The Artist Loft: Affordable Housing (for White People)
Do these tax-subsidized apartments perpetuate segregation by excluding some low-income households?

What is Causing Our Epidemic of Loneliness and How Can We Fix It?
Researchers share what Americans have to say about social disconnection and potential solutions

Hike, Bike, Drive Offline – Navigate with Privacy
Discover more of your journey - Powered by the community
CityNerd — Is It An Actual Thing? And Can Cities Fix It?
If you're like a lot of people, the whole idea of the "male loneliness epidemic" elicits a huge eye roll more than anything. Well, today we're digging into the research on why this is an emerging issue, and whether urban planning is part of the solution.

How Social Isolation Is Killing Us (Published 2016)
Research confirms our deepest intuition: Human connection lies at the heart of human well-being.

Computational Public Space
Researchers Confront an Epidemic of Loneliness (Published 2016)
Social isolation is linked to physical illness and to functional and cognitive decline. Programs to reach out to the elderly are growing, particularly in Britain.

Exploring the social life of urban spaces through AI
We analyze changes in pedestrian behavior over a 30-y period in four urban public spaces located in New York, Boston, and Philadelphia. Building on William Whyte’s observational work, which involved manual video analysis of pedestrian behaviors, we employ computer vision and deep learning techniques to examine video footage from 1979–80 and 2008–10. Our analysis measures changes in walking speed, lingering behavior, group sizes, and group formation. We find that the average walking speed has increased by 15%, while the time spent lingering in these spaces has halved across all locations. Although the percentage of pedestrians walking alone remained relatively stable (from 67% to 68%), the frequency of group encounters declined, indicating fewer interactions in public spaces. This shift suggests that urban residents are using streets as thoroughfares rather than as social spaces, which has important implications for the role of public spaces in fostering social engagement.

Loneliness epidemic
The concept of a "loneliness epidemic" relating to rising rates of social isolation was first described in the 2000s. Robert D. Putnam's 2000 study Bowling Alone was an early instance of describing loneliness as an epidemic, arguing that decreased participation in civic life and community groups was weakening social bonds in the United States.[5]
Urban congestion relief experiments through routing-app interventions
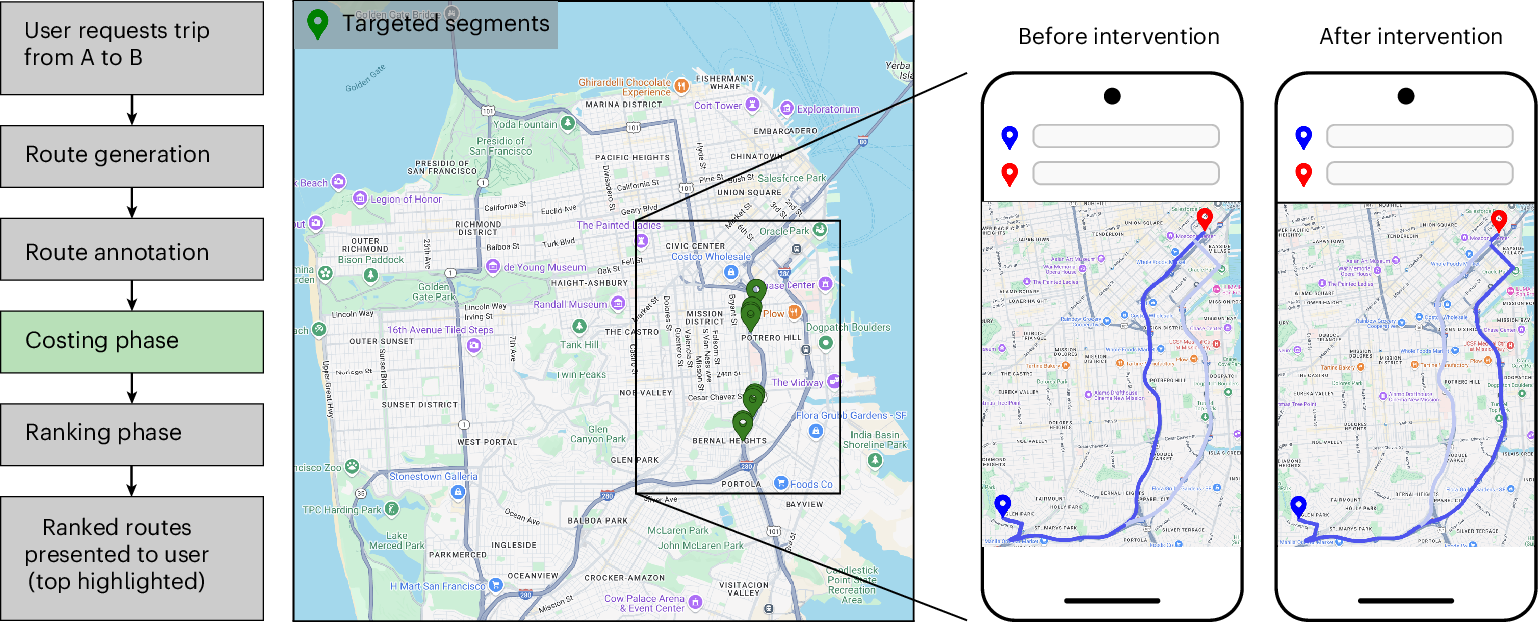
Traffic congestion remains a persistent challenge for urban mobility, increasing travel delays and elevating CO2 emissions. The widespread use of smartphones and GPS navigation creates new opportunities to mitigate congestion through routing optimizations in apps, yet real-world evidence for the effectiveness of such interventions is limited. Here we report large-scale empirical experiments evaluating routing-based traffic interventions on ~100 highly congested road segments across 10 major US cities. By rerouting a small share of Google Maps trips from targeted congested highway and arterial segments to less congested alternatives of equivalent road-classes with comparable travel times, we observe a city-average 2% increase in vehicle speeds on the intervened segments, along with improved travel times 0.7% and potential annual reductions exceeding 1,000 tons of CO2-equivalent emissions per city in the majority of studied locations. These findings provide evidence that marginal routing interventions involving a small proportion of vehicles can measurably enhance overall road network efficiency, offering a practical pathway to easing congestion and advancing urban sustainability.
The Local Connection Crisis: New Data on What Communities Need
As diversity increases, people paradoxically perceive social groups as more similar
With globalization and immigration, societal contexts differ in sheer variety of resident social groups. Social diversity challenges individuals to think in new ways about new kinds of people and where their groups all stand, relative to each other. However, psychological science does not yet specify how human minds represent social diversity, in homogeneous or heterogenous contexts. Mental maps of the array of society’s groups should differ when individuals inhabit more and less diverse ecologies. Nonetheless, predictions disagree on how they should differ. Confirmation bias suggests more diversity means more stereotype dispersion: With increased exposure, perceivers’ mental maps might differentiate more among groups, so their stereotypes would spread out (disperse). In contrast, individuation suggests more diversity means less stereotype dispersion, as perceivers experience within-group variety and between-group overlap. Worldwide, nationwide, individual, and longitudinal datasets ( n = 12,011) revealed a diversity paradox: More diversity consistently meant less stereotype dispersion. Both contextual and perceived ethnic diversity correlate with decreased stereotype dispersion. Countries and US states with higher levels of ethnic diversity (e.g., South Africa and Hawaii, versus South Korea and Vermont), online individuals who perceive more ethnic diversity, and students who moved to more ethnically diverse colleges mentally represent ethnic groups as more similar to each other, on warmth and competence stereotypes. Homogeneity shows more-differentiated stereotypes; ironically, those with the least exposure have the most-distinct stereotypes. Diversity means less-differentiated stereotypes, as in the melting pot metaphor. Diversity and reduced dispersion also correlate positively with subjective wellbeing.

The Missing Piece: How Location Data is Coming to the AT Protocol
A deep dive into community-driven geolocation schemas, emerging projects, and the future of location-aware social networking on Bluesky
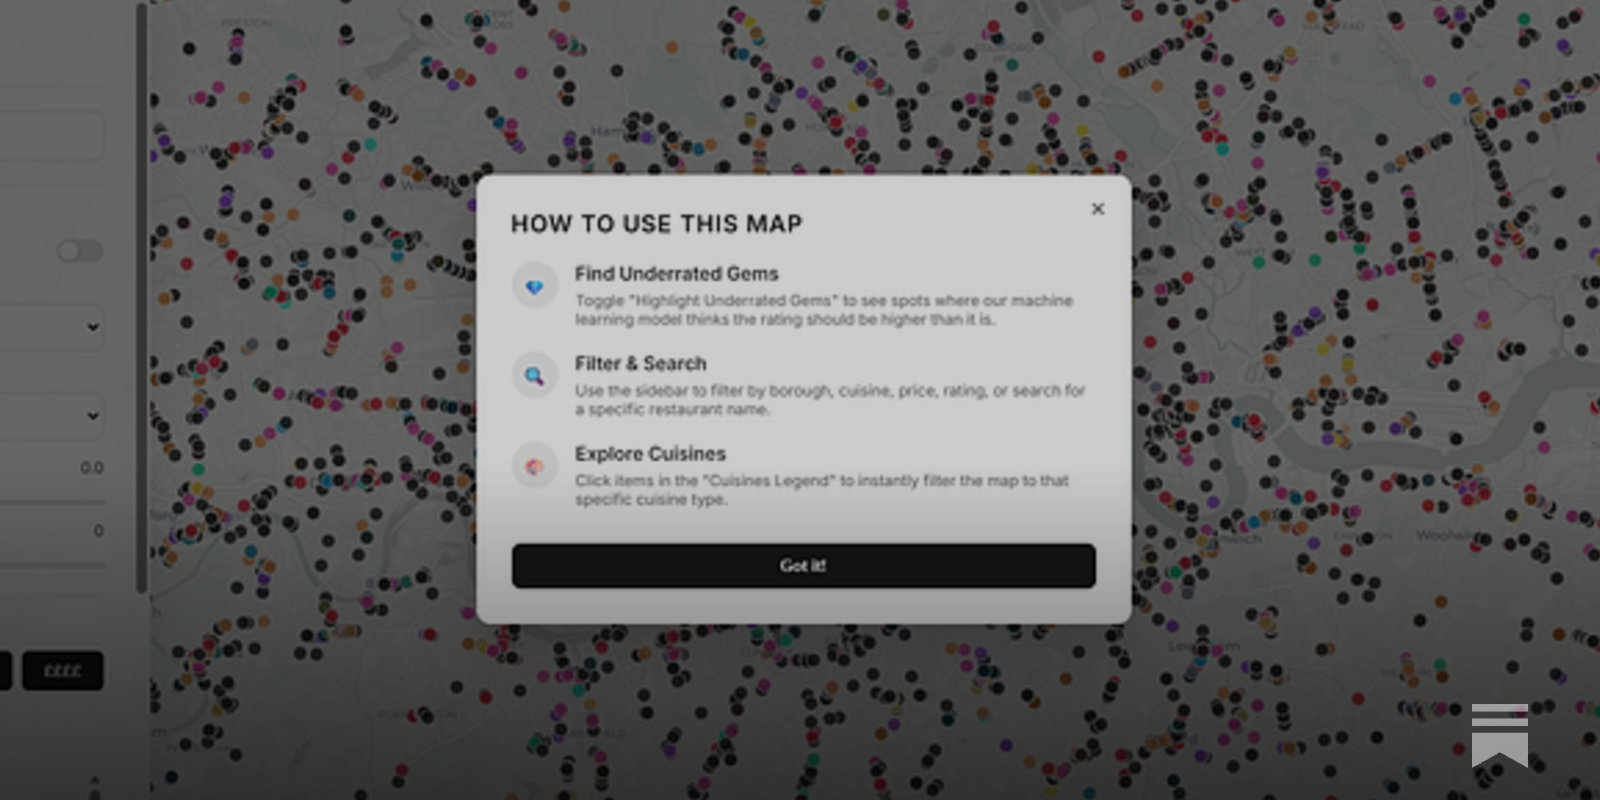
How Google Maps quietly allocates survival across London’s restaurants - and how I built a dashboard to see through it
I wanted a dinner recommendation and got a research agenda instead. Using 13000+ restaurants, I rebuild its ratings with machine learning and map how algorithmic visibility actually distributes power.