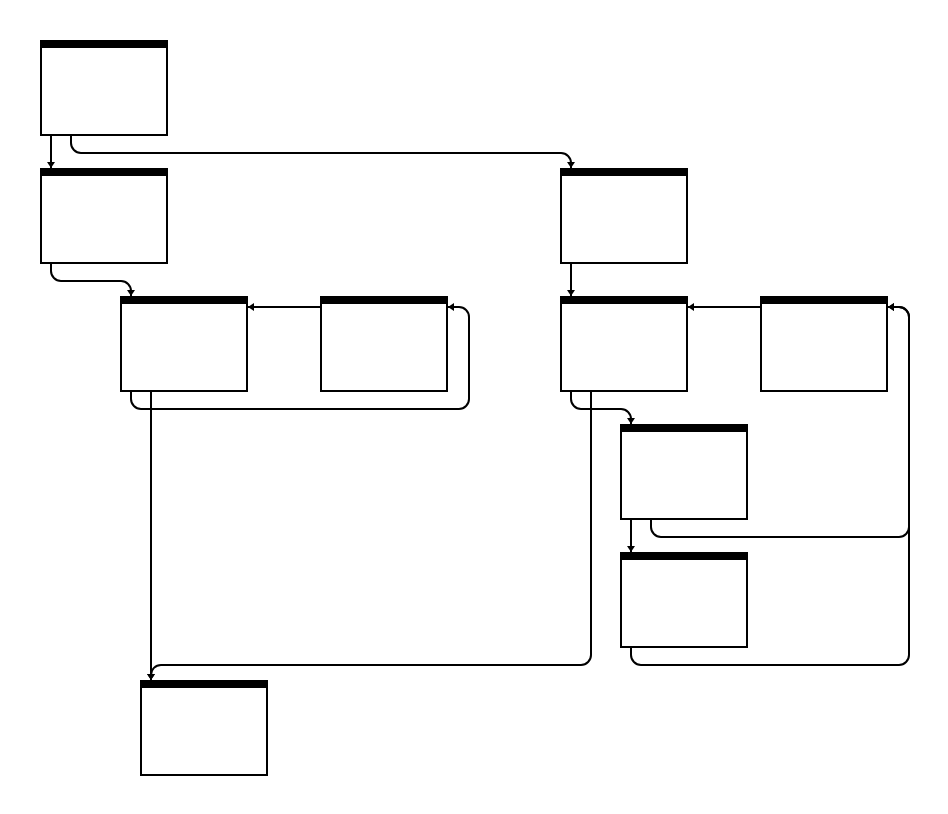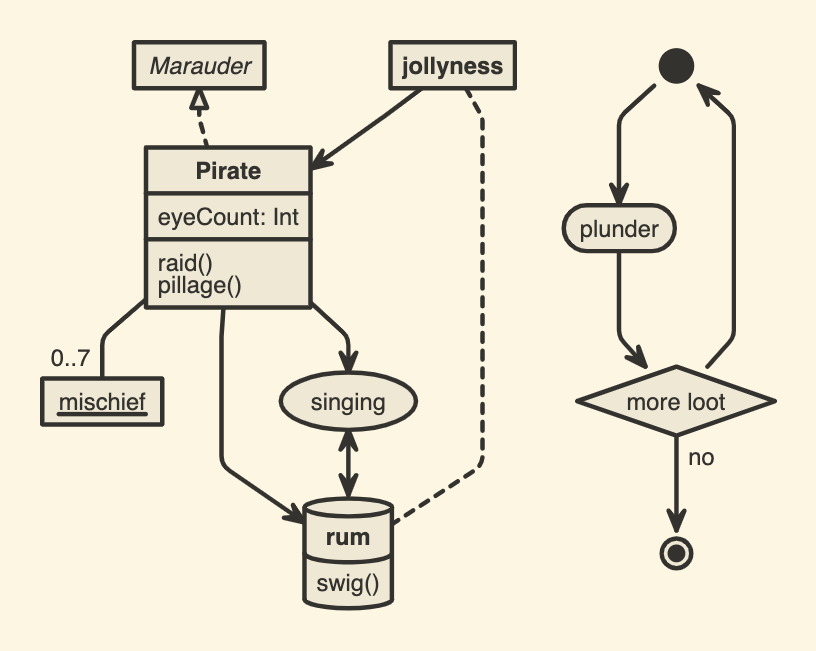
A tool for drawing diagrams based on syntax. Supercharge your boxes and arrows.
Flowchart Maker & Online Diagram Software

Security-first diagramming for teams | draw.io
Free, open source diagramming application with 100M+ users. Store your data wherever you want—we can't access it.


Lini — diagrams, charts, drawings and schematics from plain text
Lini is a small text-to-diagram language: flowcharts, mindmaps, charts, sequence diagrams, ER schemas, engineering drawings, floor plans and circuit schematics from plain text, compiled to clean, themeable SVG. Open source, written in Rust, and it runs in the browser.
What is SoaML? How to Draw SoaML Diagrams?
Quick SoaML tutorial for fast learning of SoaML. It's written to explain what SoaML is, how to use SoaML for SOA and how to draw the various SoaML diagrams.

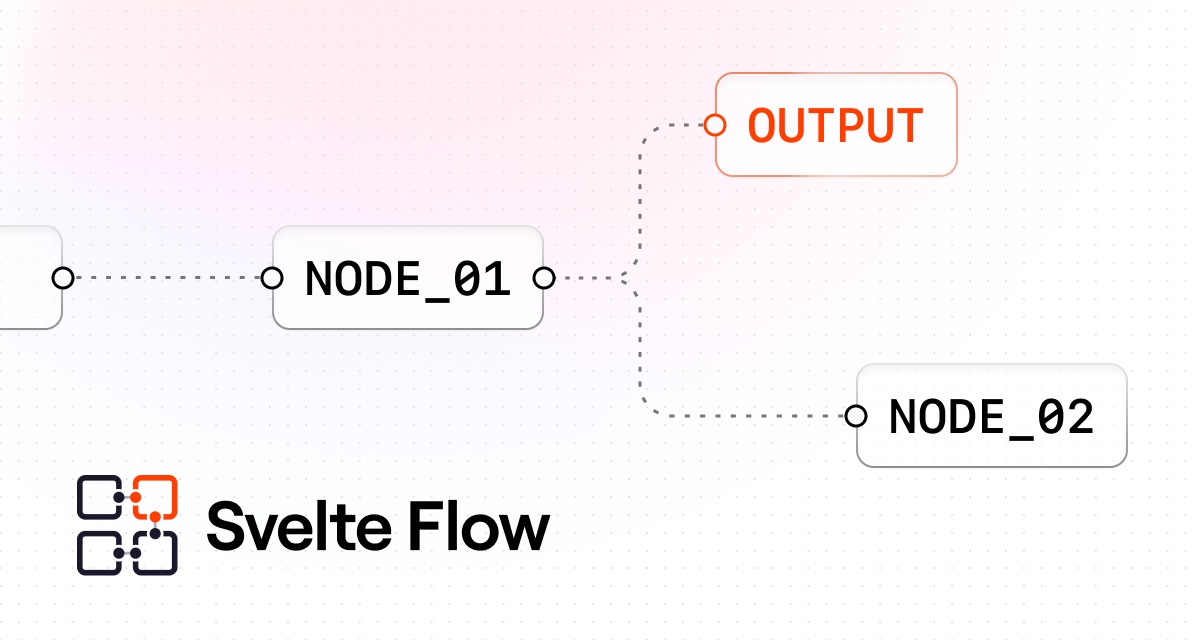
The Node-Based UI for Svelte - Svelte Flow
A customizable Svelte component for building node-based editors and interactive diagrams
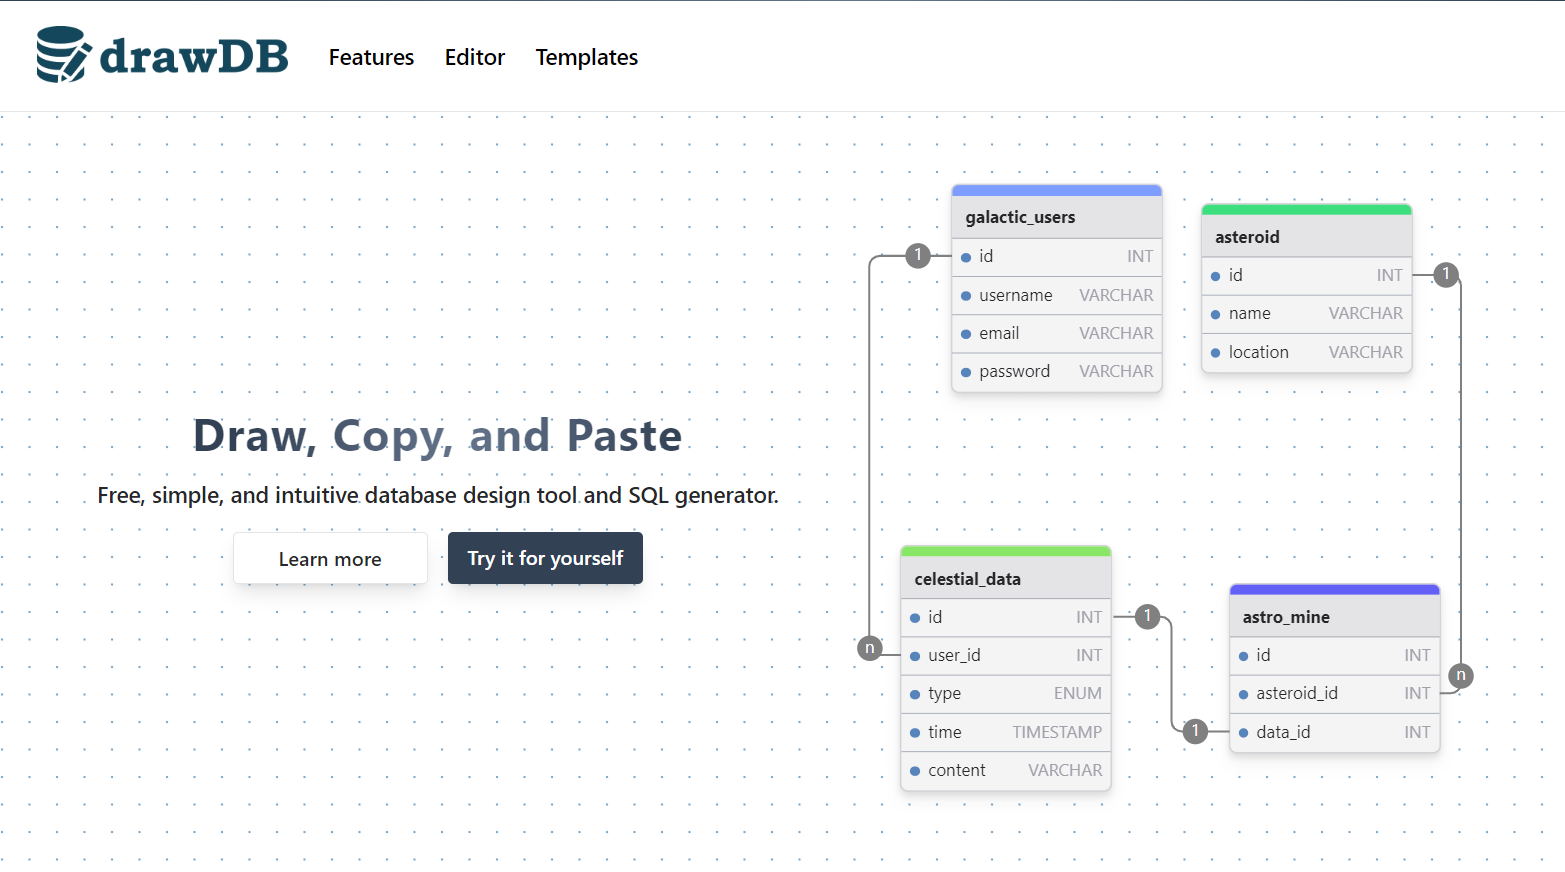
drawDB | Online database diagram editor and SQL generator
Online database entity-relationship diagram editor, data modeler, and SQL generator. Design, visualize, and export scripts without an account and completely free of charge.

Documentation — Terminal Graph
Download Terminal Graph beta, learn the shortcuts, nodes, and dataflow model.
Introduction — pyNomo Documentation 0.3.2.2 documentation
A nomogram or nomograph is a diagram that provides an easy, graphical way of calculating the result of a mathematical formula. Sometimes also called an alignment chart, a nomogram consists of a set of numbered scales, usually one for each variable in the formula, arranged so that a straightedge can be placed across known values to find the unknown value that solves the formula. Since an equation in two variables is usually represented by a graph, most nomograms represent formulas that involve three or more variables.
ggsql: A grammar of graphics for SQL
Introducing ggsql, a grammar of graphics for SQL that lets you describe visualizations directly inside SQL queries.

Living documents and interactive schematics — Selin Jessa
Using LLMs to turn static figures from data analysis, schematics, and publications into interactive widgets as tools for thought
Who needs Graphviz when you can build it yourself?
Exploring a new layout algorithm for control flow graphs.