

The React Graph Gallery displays hundreds of charts made with React, always with explanation and reproduciible code

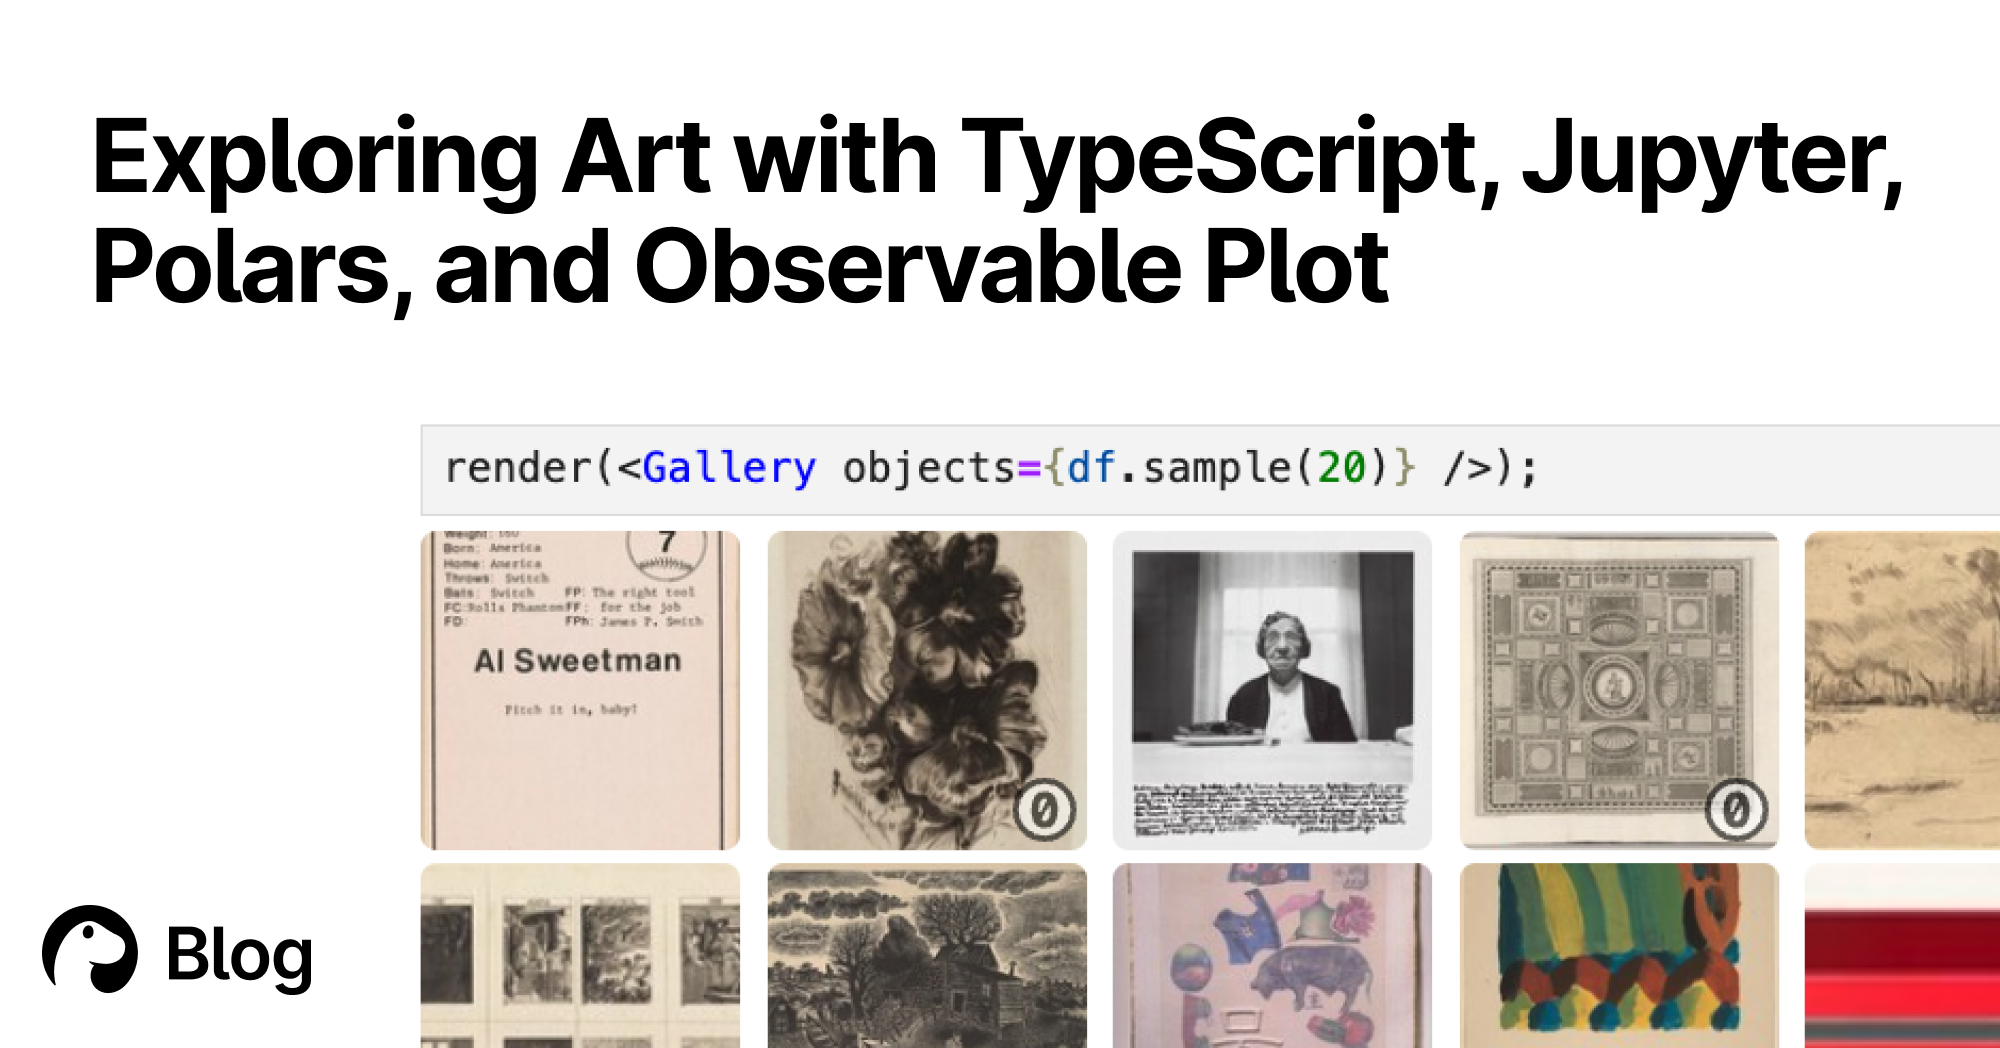
Exploring Art with TypeScript, Jupyter, Polars, and Observable Plot | Deno
With Deno's Jupyter support, you can explore, interact, and create interactive charts with TypeScript and HTML. Here's a tutorial featuring data of over 130,000 famous artworks.
jwilber/roughViz
Reusable JavaScript library for creating sketchy/hand-drawn styled charts in the browser.
Chart Design Principles | Hands-On Data Visualization
Tell your story and show it with data, using free and easy-to-learn tools on the web. This introductory book teaches you how to design interactive charts and customized maps for your website, beginning with easy drag-and-drop tools, such as Google Sheets, Datawrapper, and Tableau Public. You will also gradually learn how to edit open-source code templates built with Chart.js, Highcharts, and Leaflet on GitHub. Follow along with the step-by-step tutorials, real-world examples, and online resources. This book is ideal for students, non-profit organizations, small business owners, local governments, journalists, academics, or anyone who wants to tell their story and show the data. No coding experience is required.

chartgerink - Overview
chartgerink has 41 repositories available. Follow their code on GitHub.

React
React is the library for web and native user interfaces. Build user interfaces out of individual pieces called components written in JavaScript. React is designed to let you seamlessly combine components written by independent people, teams, and organizations.

Sigma.js
a JavaScript library aimed at visualizing graphs of thousands of nodes and edges
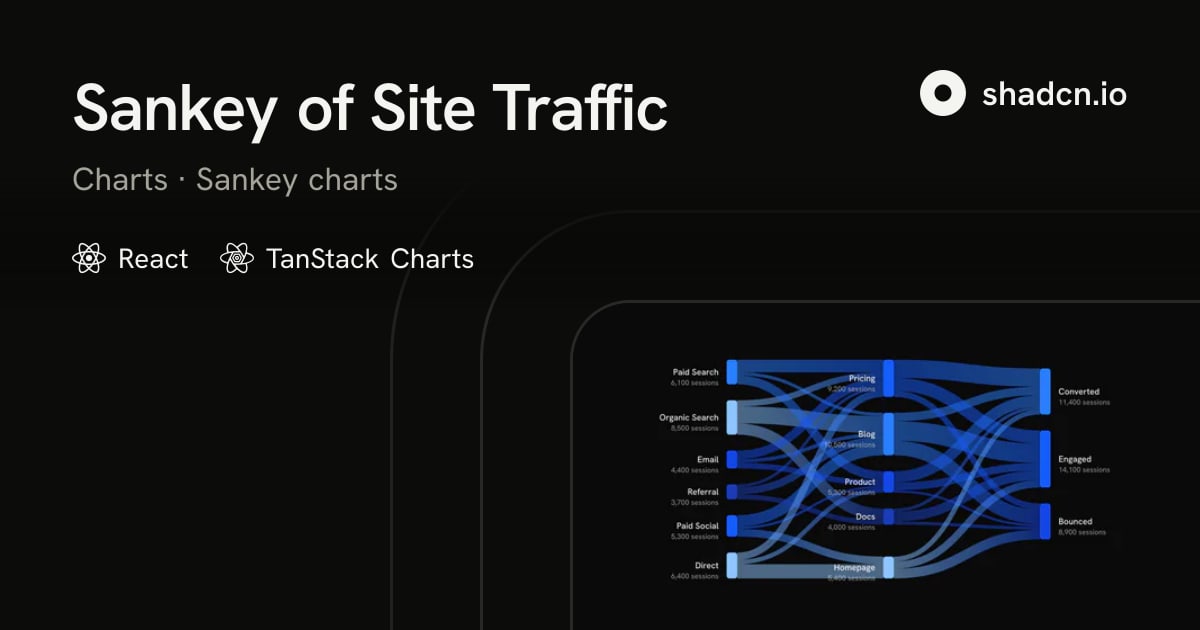
Sankey of Site Traffic for React with TanStack Charts
Sessions from six sources through five landing pages to three outcomes, each link a gradient between its nodes.
ApexCharts Editor - Online Graph Maker
Node-Based UIs in React - React Flow
Highly customizable React library for workflow builders, no-code apps, image processing, visualizers, and more


The 34th International Symposium on Graph Drawing and Network Visualization
The 34th International Symposium on Graph Drawing and Network Visualization will be held at Brock University in St. Catharines, Ontario, Canada from August 17-21, 2026. A PhD school will take place on August 17-18, 2026.