

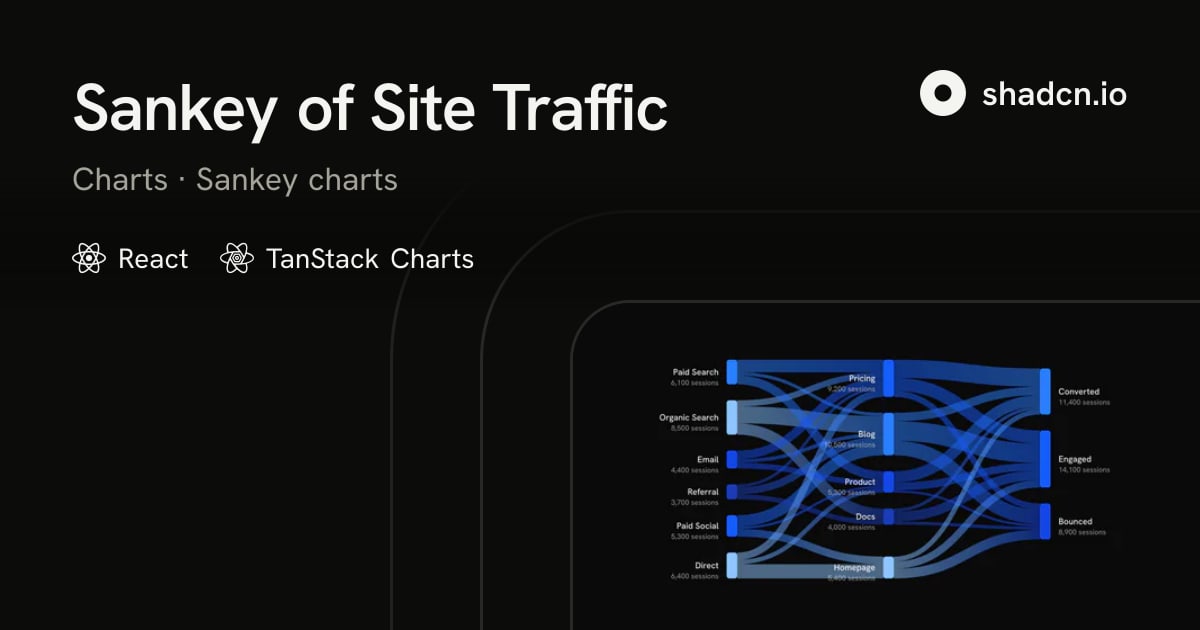
Sessions from six sources through five landing pages to three outcomes, each link a gradient between its nodes.
Performance & Request Waterfalls | TanStack Query React Docs
Application performance is a broad and complex area and while React Query can't make your APIs faster, there are still things to be mindful about in how you use React Query to ensure the best performa...
Learn to build unique charts with React
The React Graph Gallery displays hundreds of charts made with React, always with explanation and reproduciible code
TanStack Charts
A typed, tree-shakable chart grammar for SVG and Canvas. Compose marks, views, scales, transforms, interactions, and motion with compact primitives or D3-compatible inputs.
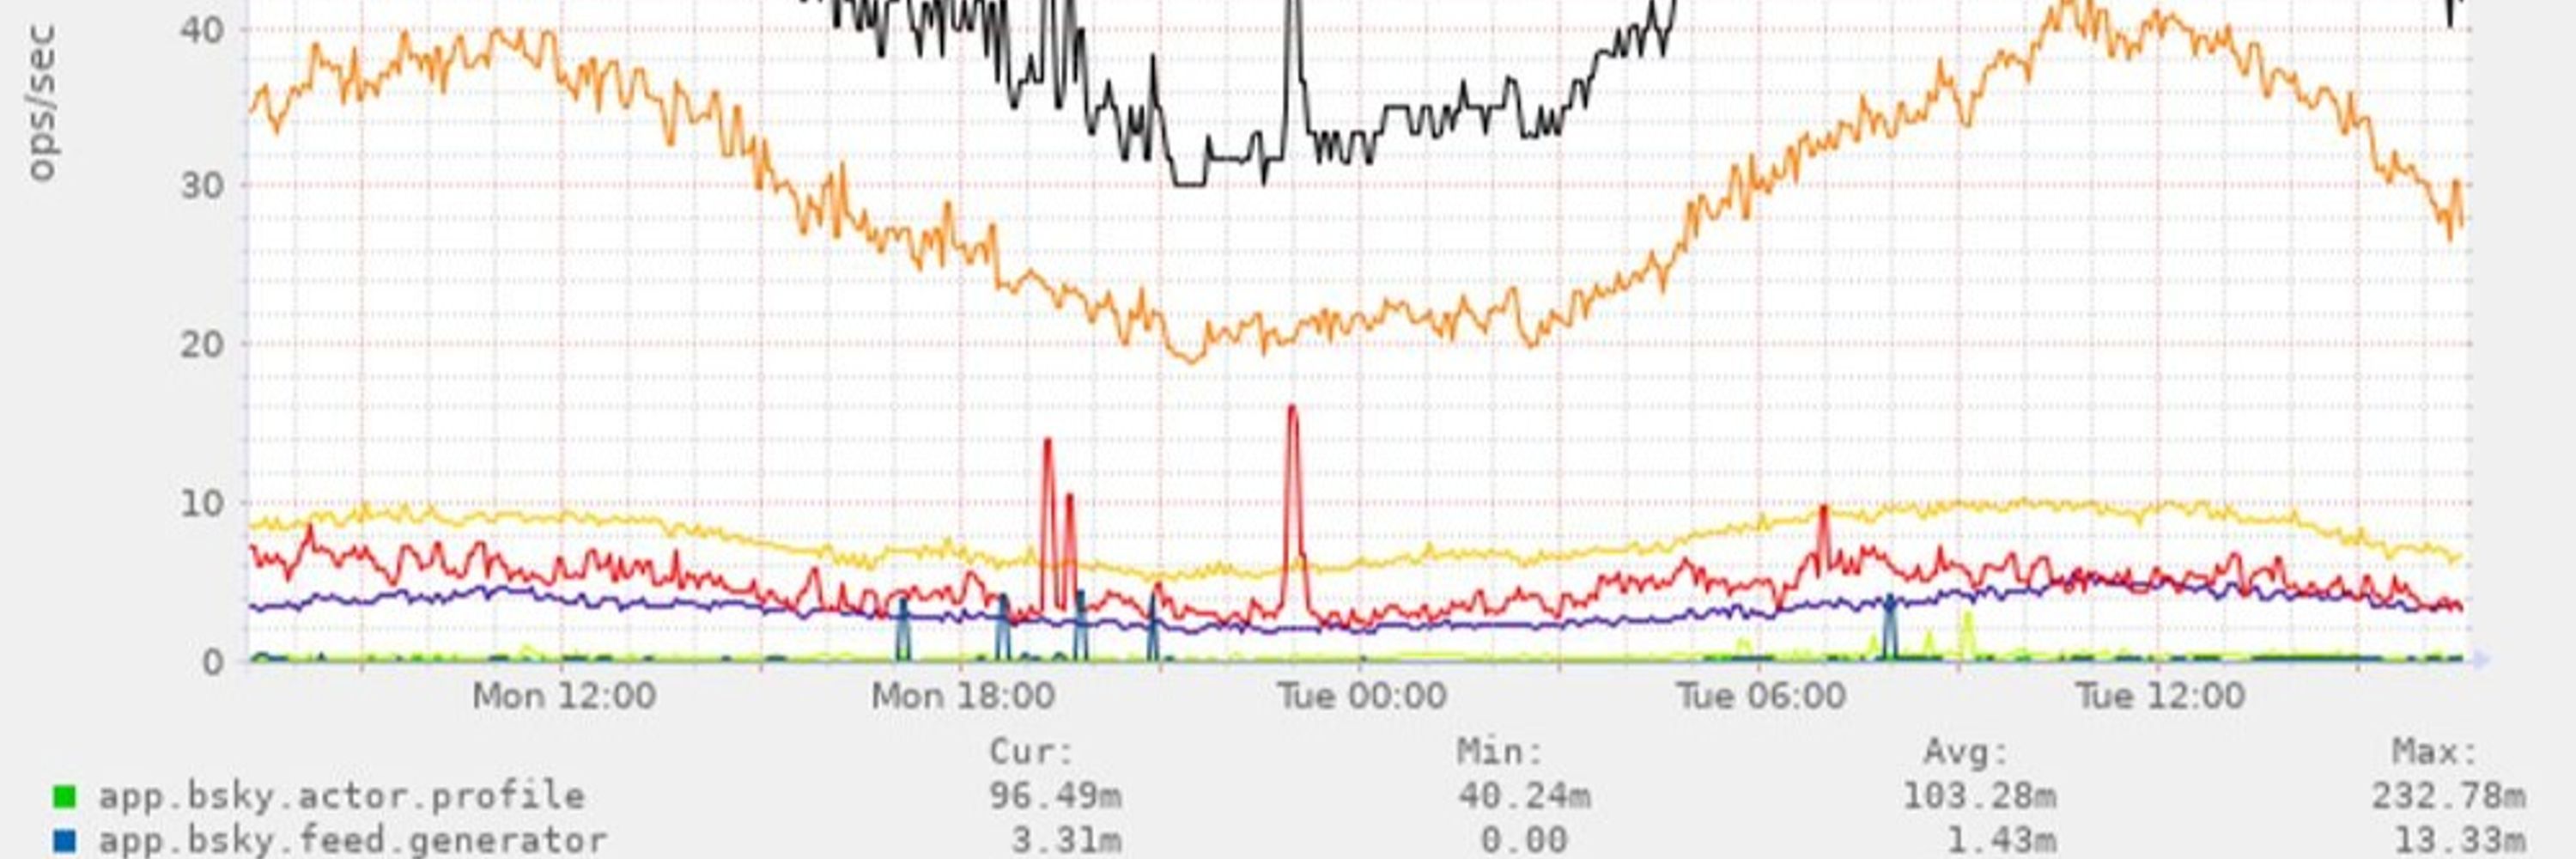
bsky charts (@bskycharts.edavis.dev)
posting unofficial charts of bluesky network activity 🤖📈 more at https://bskycharts.edavis.dev/bluesky-day.html chart guide: https://edavis.dev/notes/bskycharts-guide/
Hive Plots - Linear Layout for Network Visualization - Visually Interpreting Network Structure and Content Made Possible
the hive plot is a perceptually uniform and scalable linear layout visualization for network visual analytics
Shipmap.org
An incredible visualisation of global shipping traffic, created by Kiln.digital and the UCL Energy Institute.

LLM traffic: What’s actually happening and what to do about it
Learnings from Sentry's data and why web discoverability as a whole shifted our strategy.
The Day I Logged 1 In Every 2000 Public IPv4: Visualizing The AI Scraper DDoS - VulpineCitrus
In an attempt to grasp the magnitude of web scraper attacks against my websites, i went the way of visualizing.
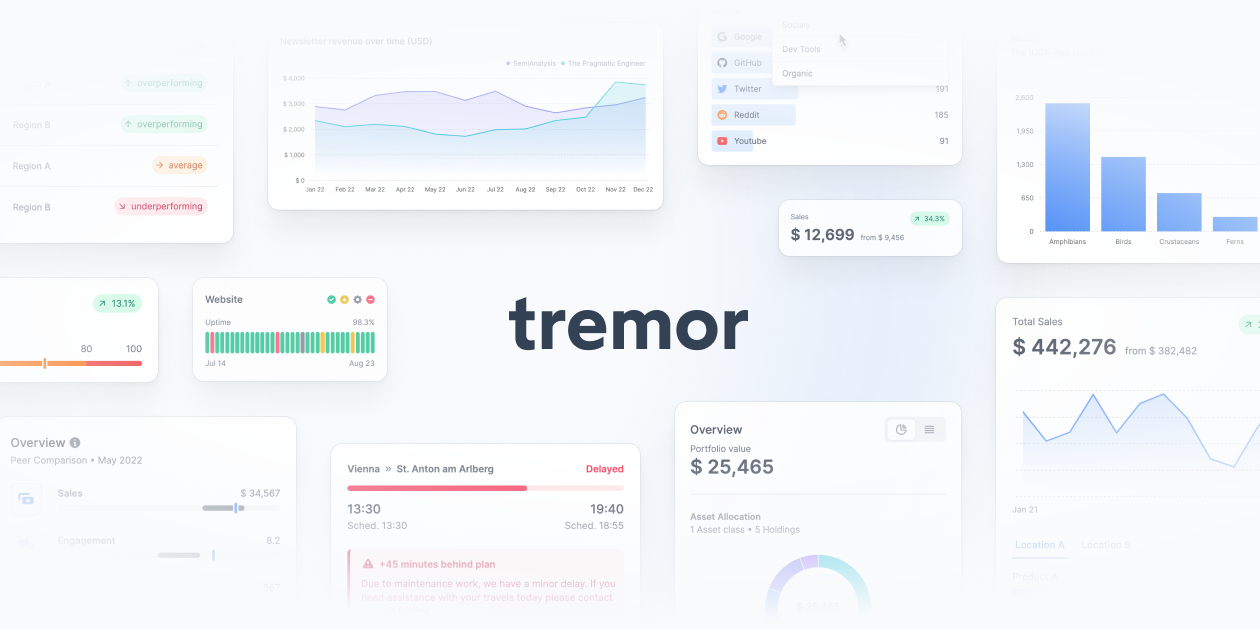
Tremor – Copy-and-Paste Tailwind CSS UI Components for Charts and Dashboards
Open-source, accessible React UI components styled with Tailwind CSS to build charts and dashboards.
The Web3 Stack
I have yet to see an actual illustration of the Web3 stack. So this is an attempt. Given how expansive the Web3 ecosystem is, this diagram is almost certainly incomplete, and likely has a few inaccuracies.

Developing with ReactJS: An Interview with Gatsby's Kyle Mathews | Netlify
Realize the speed, agility and performance of a scalable, composable web architecture with Netlify. Explore the composable web platform now!

VisQuill – Reactive Geometry for Interactive Data Visualization
VisQuill lets you explore data through interactive visuals or build your own using a reactive geometry SDK. Create geospatial and interactive visual systems with real-time updates.

TanStack Start 1.0 is Stable | TanStack Blog
TanStack Start 1.0 is stable and ready for production.
Digital-Trust-Graph-Online-Slides-.pdf