


An incredible visualisation of global shipping traffic, created by Kiln.digital and the UCL Energy Institute.
Cargo Grid Viewer
Tool for visualizing, comparing, and managing cargo grids for Star Citizen.
How ordinary ship traffic could help map the uncharted Arctic Ocean seafloor - ArcticToday
Throughout world, the ocean floor’s details remain largely a mystery; less than 10 percent has been mapped using modern sonar technology. Even in the United States, which has some of the best maritime maps in the world, only one-third of the ocean and coastal waters have been mapped to modern standards. Access to content from...

The Enshittification of Google Maps
Hi friends, Almost every time I drive down the West Side Highway in New York City, Google Maps tells me to get off at the ship terminal – even though I am...

Megaproject Dashboard — Global Infrastructure Tracker
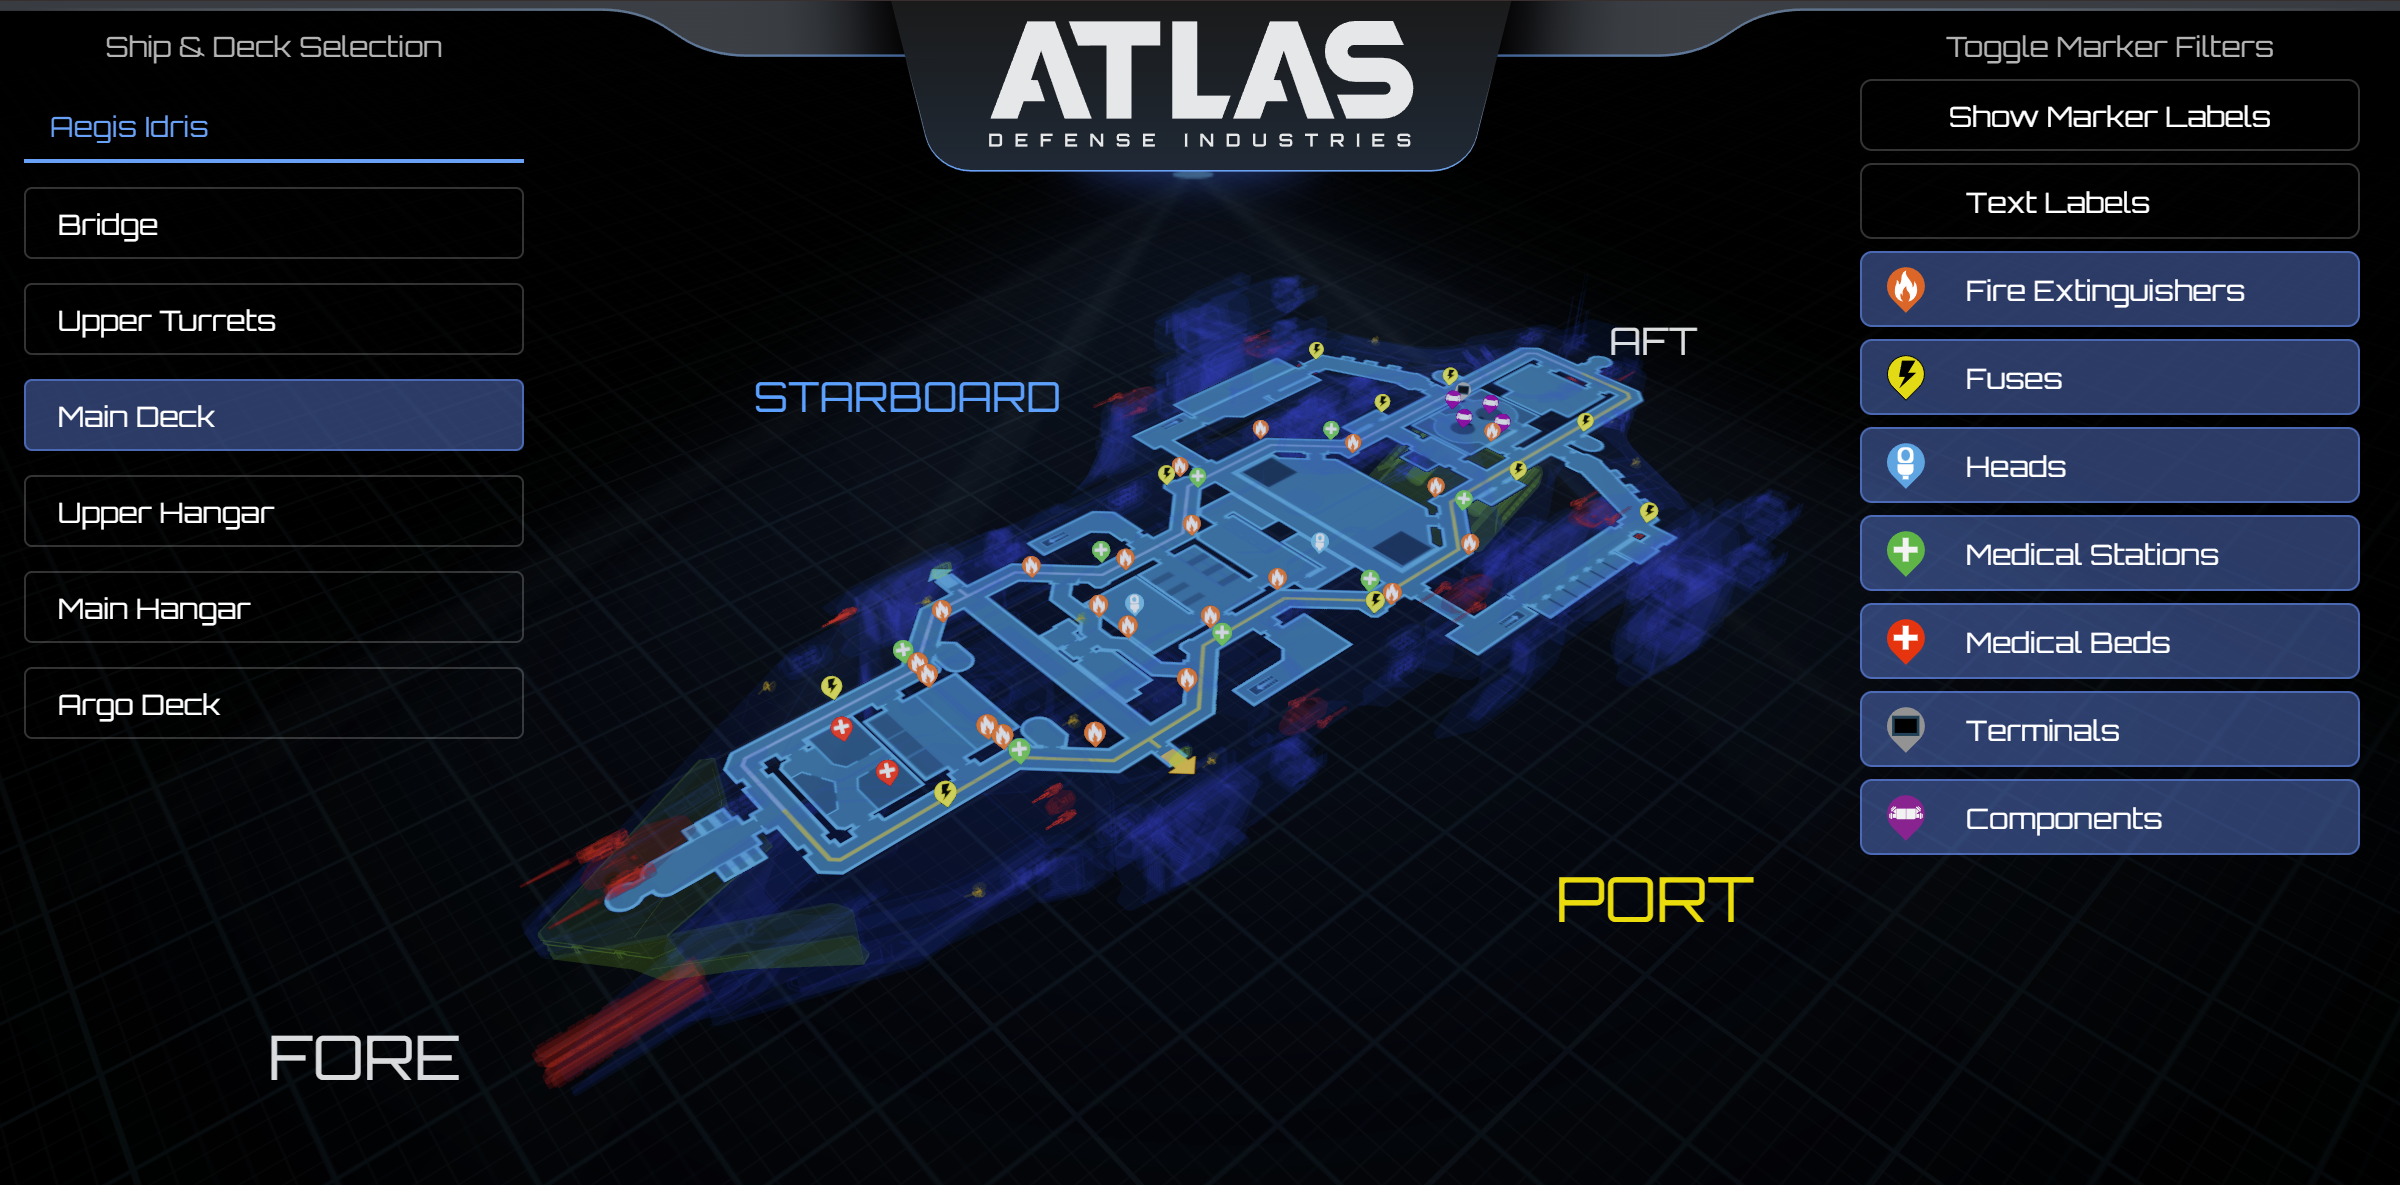
Star Citizen Ship Maps
Interactive 3D ship maps for Idris, Perseus, Hammerhead, Reclaimer, Polaris, and Starfarer.
Home | FleetYards.net
FleetYards.net, Your Database for all Information related to Ships from “Star Citizen“.

Hive Plots - Linear Layout for Network Visualization - Visually Interpreting Network Structure and Content Made Possible
the hive plot is a perceptually uniform and scalable linear layout visualization for network visual analytics
Launch into the future - Spaceship
Get online seamlessly with Spaceship Domains, Hosting, Email and other online products and solutions. Spaceship connects you with digital products empowering your ideas with top tier products, security and privacy, managed through a powerful and fast platform.

Launch into the future - Spaceship
Get online seamlessly with Spaceship Domains, Hosting, Email and other online products and solutions. Spaceship connects you with digital products empowering your ideas with top tier products, security and privacy, managed through a powerful and fast platform.
Chart Design Principles | Hands-On Data Visualization
Tell your story and show it with data, using free and easy-to-learn tools on the web. This introductory book teaches you how to design interactive charts and customized maps for your website, beginning with easy drag-and-drop tools, such as Google Sheets, Datawrapper, and Tableau Public. You will also gradually learn how to edit open-source code templates built with Chart.js, Highcharts, and Leaflet on GitHub. Follow along with the step-by-step tutorials, real-world examples, and online resources. This book is ideal for students, non-profit organizations, small business owners, local governments, journalists, academics, or anyone who wants to tell their story and show the data. No coding experience is required.
Open Infrastructure Map
Open map of the world's electricity, telecoms, oil, and gas infrastructure, using data from OpenStreetMap.
Live Flight Tracker - Real-Time Flight Tracker Map | Flightradar24
The world’s most popular flight tracker. Track planes in real-time on our flight tracker map and get up-to-date flight status & airport information.

A side selective line simplification algorithm for nautical chart generalization
Depth contours are essential chart features, portraying seabed morphology and delineating the depth areas used by navigation systems to assess route safety and trigger alarms. Their portrayal must ...

Cosmograph: Beautiful Visualization and Analytics | Cosmograph
Beautiful Visualization and Analytics

