


View and compare GitHub star history graph of open source projects.
Open Source
These GitHub repositories contain open-source software developed by the Observatory on Social Media for various projects

A Replication Study on Measuring the Growth of Open Source
Context: Over the last decades, open-source software has pervaded the software industry and has become one of the key pillars in software engineering. The incomparable growth of open source reflected that pervasion: Prior work described open source as a whole to be growing linearly, polynomially, or even exponentially. Objective: In this study, we explore the long-term growth of open source and corroborating previous findings by replicating previous studies on measuring the growth of open source projects. Method: We replicate four existing measurements on the growth of open source on a sample of 172,833 open-source projects using Open Hub as the measurement system: We analyzed lines of code, commits, new projects, and the number of open-source contributors over the last 30 years in the known open-source universe. Results: We found growth of open source to be exhausted: After an initial exponential growth, all measurements show a monotonic downwards trend since its peak in 2013. None of the existing growth models could stand the test of time. Conclusion: Our results raise more questions on the growth of open source and the representativeness of Open Hub as a proxy for describing open source. We discuss multiple interpretations for our observations and encourage further research using alternative data sets.

Red Squares — the GitHub outage graph
A satirical contribution graph: red squares track GitHub.com platform outages instead of green squares tracking commits.

GitHub’s one-dimensional view of open source contributions – Wes McKinney
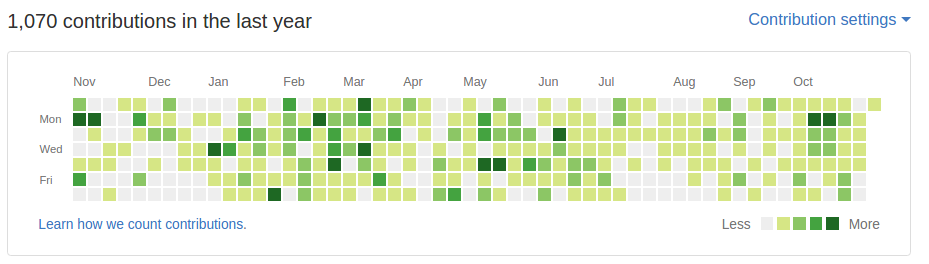
TL;DR One of the most harmful parts of the GitHub platform is the code contribution calendar. This “hacker score card” overemphasizes the value of commits over the other kinds of important contributions to open source projects, like doing code reviews and discussing bugs and new features on the issue tracker.
Is GitHub Cooked?
Track GitHub service incidents and outages. Real-time stats, incident history, and downtime analytics.


The Asymmetry of Open Source - Matt Holt
A comprehensive guide to funding open source software projects

Code Galaxies Visualization
Code galaxies visualization allows you to explore huge graphs of software package managers (npm, go, ruby gems, composer, etc.)

Hire talented free software developers - Sourcehut
sourcehut is a network of useful open source tools for software project maintainers and collaborators, including git repos, bug tracking, continuous integration, and mailing lists.
Inside GitHub's Fake Star Economy
Six million fake stars, $0.06 per click, and a VC funding pipeline that treats GitHub popularity as proof of traction. We ran our own analysis on 20 repos and found the fingerprints.

Open Source Metrics
Make informed decisions to help your open source project thrive by measuring and tracking its success.

How does SourceHut's free software consultancy work?
sourcehut is a network of useful open source tools for software project maintainers and collaborators, including git repos, bug tracking, continuous integration, and mailing lists.
SemRepo: A Knowledge Graph for Research Software and Its Scholarly Ecosystem
We present SemRepo, an RDF knowledge graph comprising over 81 million triples describing nearly 200,000 GitHub repositories associated with scientific research. SemRepo captures repository-level metadata, such as contributors, issues, and programming languages, and interlinks this information with external scholarly knowledge graphs. In particular, repository authors are linked to their profiles in SemOpenAlex, repositories are connected to scholarly publications in LPWC, and research artifacts, such as datasets and experiments, are linked via MLSea-KG. This integration enables queries that span publications and their scholarly artifacts, which are typically fragmented across separate platforms. SemRepo supports analyses that are difficult to perform with existing resources in isolation, including provenance reconstruction across repositories and publications, as well as the systematic identification of risks to research reproducibility and software sustainability. By unifying research software with its scholarly context in a single graph, SemRepo provides an important infrastructure for large-scale analysis of software within the broader scientific research ecosystem.
A simple way of visualizing git repository
Some time ago, a new colleague joined our department and started working on a platform we provide. During his initial days, I noticed he was using an interactive Python shell to create treemap visualizations of the project's git history.