


Quick SoaML tutorial for fast learning of SoaML. It's written to explain what SoaML is, how to use SoaML for SOA and how to draw the various SoaML diagrams.
Nomnoml
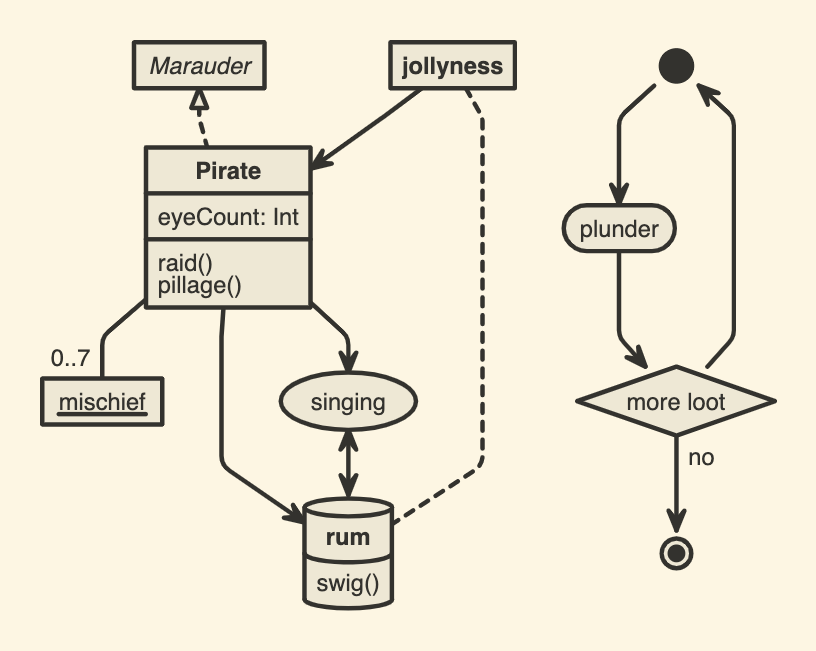
A tool for drawing diagrams based on syntax. Supercharge your boxes and arrows.
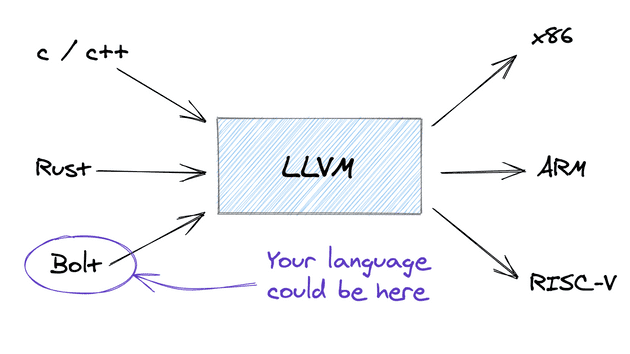
A Complete Guide to LLVM for Programming Language Creators
We'll explain the concepts underlying LLVM IR, and how you can use the LLVM C++ API in your programming language's compiler.
Lini — diagrams, charts, drawings and schematics from plain text
Lini is a small text-to-diagram language: flowcharts, mindmaps, charts, sequence diagrams, ER schemas, engineering drawings, floor plans and circuit schematics from plain text, compiled to clean, themeable SVG. Open source, written in Rust, and it runs in the browser.
stack.gl
Before getting started with stackgl, you'll want to get familiar with the basics of WebGL and GLSL. One place to start would be by trying out one of our graphics-themed NodeSchool workshops. Shader School and WebGL Workshop are interactive and may be taken in any order.
Library Guides: ATU-AT-Motif: Explanation of pages
Library Guides: ATU-AT-Motif: Explanation of pages
FROM SCRATCH STRUDEL TUTORIAL

The Ultimate Guide To Software Architecture Documentation
This guide shows you how to write, structure, visualize and manage software architecture documentation using appropriate documentation tools.

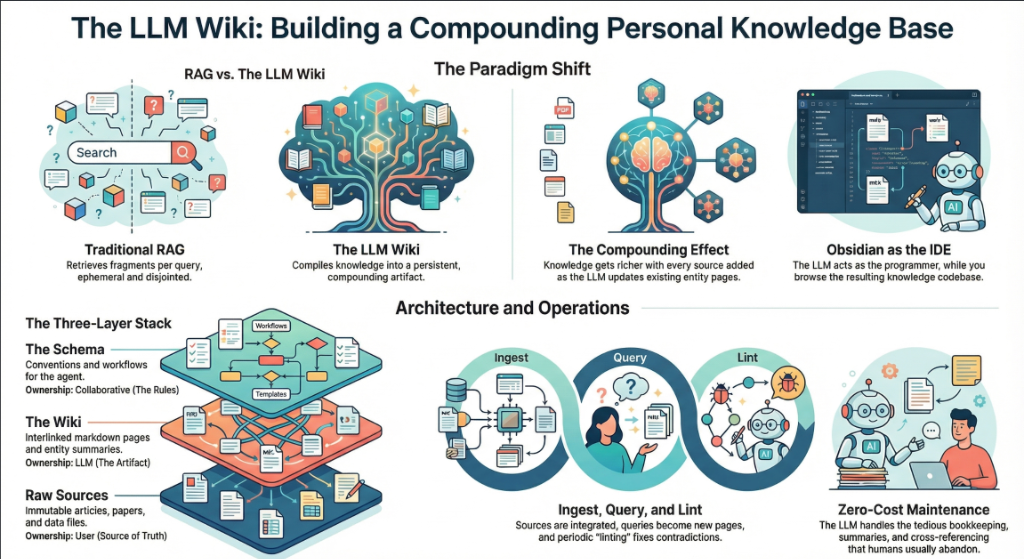
Karpathy's LLM Wiki: The Complete Guide to His Idea File
Karpathy's follow-up gist went viral. Complete breakdown with implementation examples.
ggsql: A grammar of graphics for SQL
Introducing ggsql, a grammar of graphics for SQL that lets you describe visualizations directly inside SQL queries.

visualising data structures and algorithms through animation - VisuAlgo
VisuAlgo was conceptualised in 2011 by Associate Professor Steven Halim (NUS School of Computing) as a tool to help his students better understand data structures and algorithms, by allowing them to learn the basics on their own and at their own pace. Together with his students from the National University of Singapore, a series of visualizations were developed and consolidated, from simple sorting algorithms to complex graph data structures. Though specifically designed for the use of NUS students taking various data structure and algorithm classes (CS1010/equivalent, CS2040/equivalent (inclusive of IT5003)), CS3230, CS3233, and CS4234), as advocators of online learning, we hope that curious minds around the world will find these visualizations useful as well.
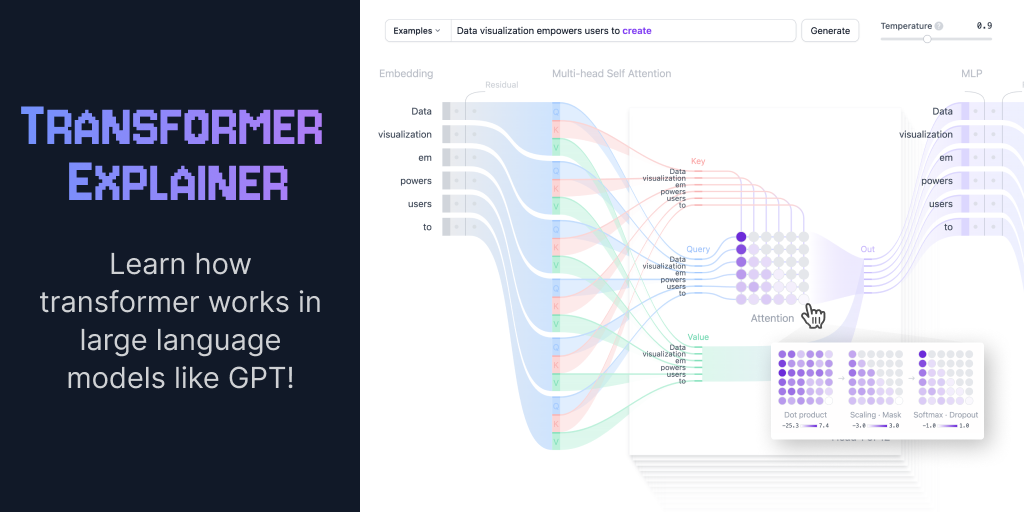
Transformer Explainer: LLM Transformer Model Visually Explained
An interactive visualization tool showing you how transformer models work in large language models (LLM) like GPT.
How to Semble?

Guides and resources about what Semble is and how to use it.

Semble bookmarklet
Semble iOS shortcut

Semble (@semble.so)
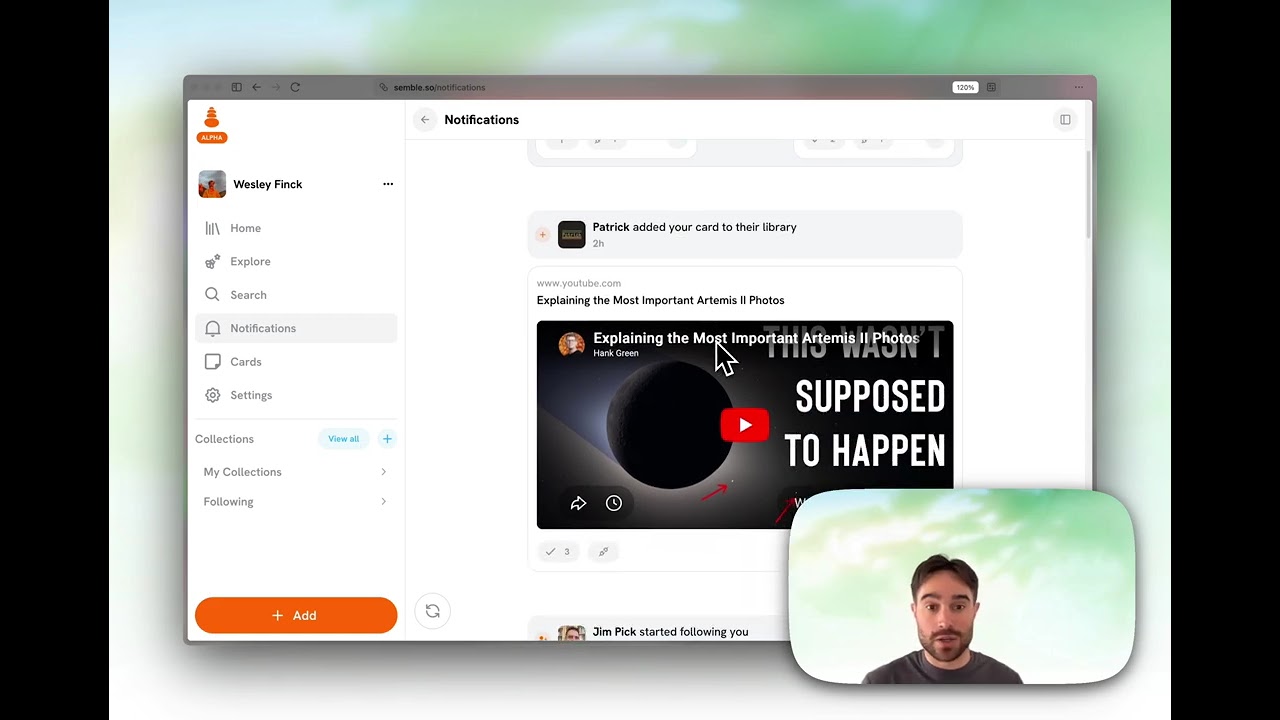
How Notifications Work in Semble

Semble Explore Feed and Follow Graph

What is the Semble Page
