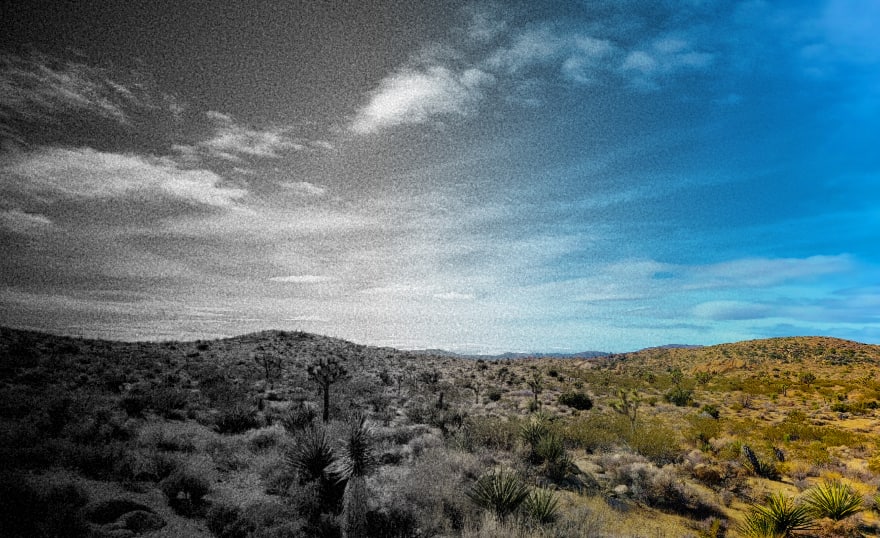


These are bleak times — but a lot of things are improving.

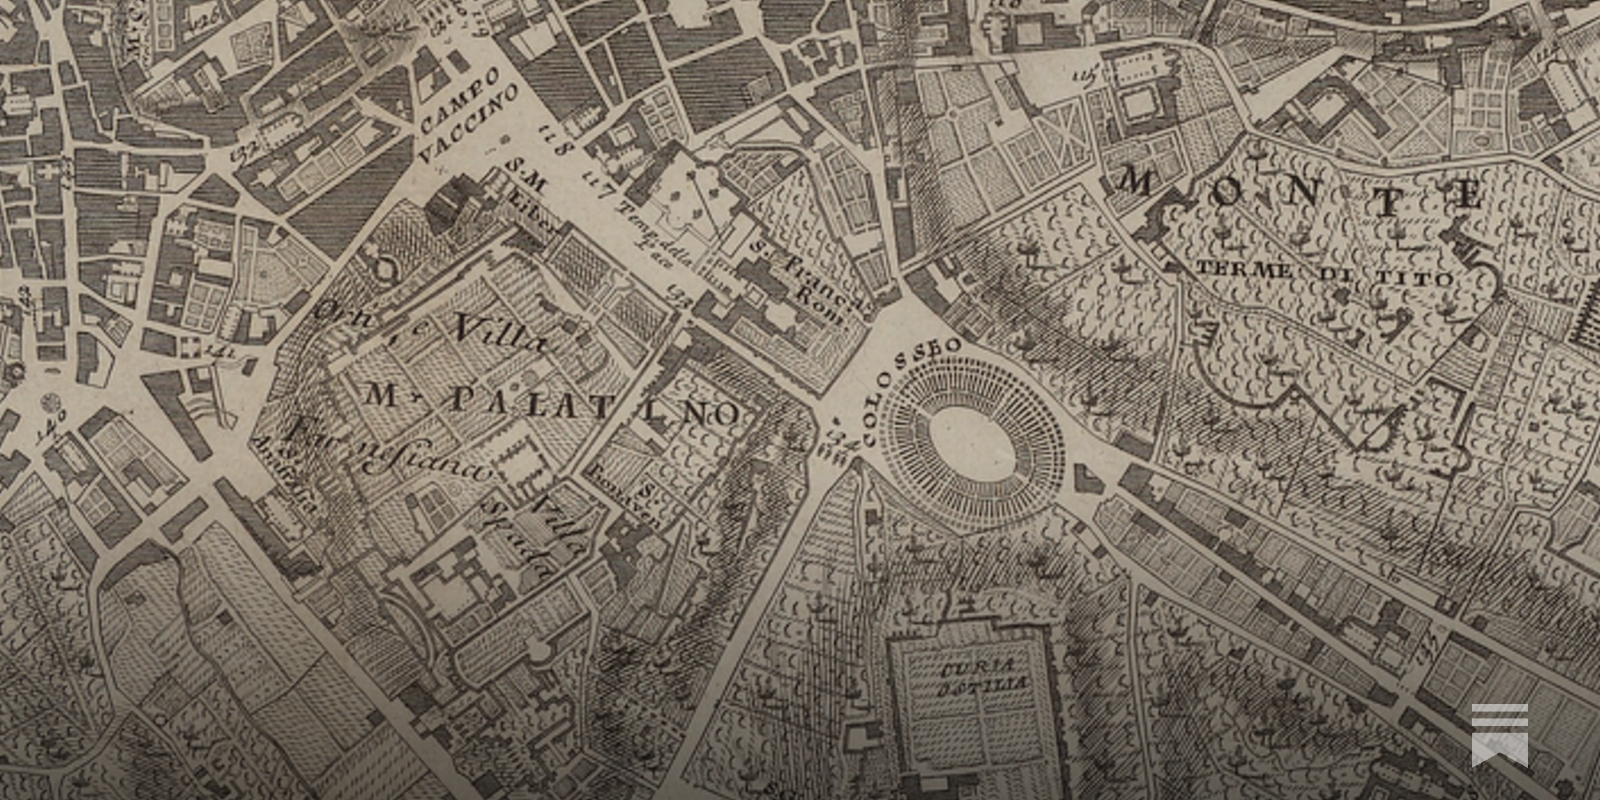
A fact-based worldview for all | Gapminder
We live in a globalized world, not only in terms of trade and migration. More people than ever care about global development. But most people have severe misconceptions about contemporary global development. We know, because we have tested people’s knowledge. One of the main reasons for this is that students don’t learn to understand the world based on statistics and facts. Instead, we have a dramatic worldview formed by outdated school books and sensationalist news-stories. People intuitively believe that most things are getting worse. The dramatic worldview leads to irrational decisions by individuals, nonprofits, governments and business. For the first time in human history reliable statistics exist. There’s data for almost every aspect of global development. The data shows a very different picture: a world where most things improve; a world that is not divided; and a world where the fast population growth will soon be over. The world has never been less bad. But that doesn’t mean it’s perfect.
How Google Maps quietly allocates survival across London’s restaurants - and how I built a dashboard to see through it
I wanted a dinner recommendation and got a research agenda instead. Using 13000+ restaurants, I rebuild its ratings with machine learning and map how algorithmic visibility actually distributes power.
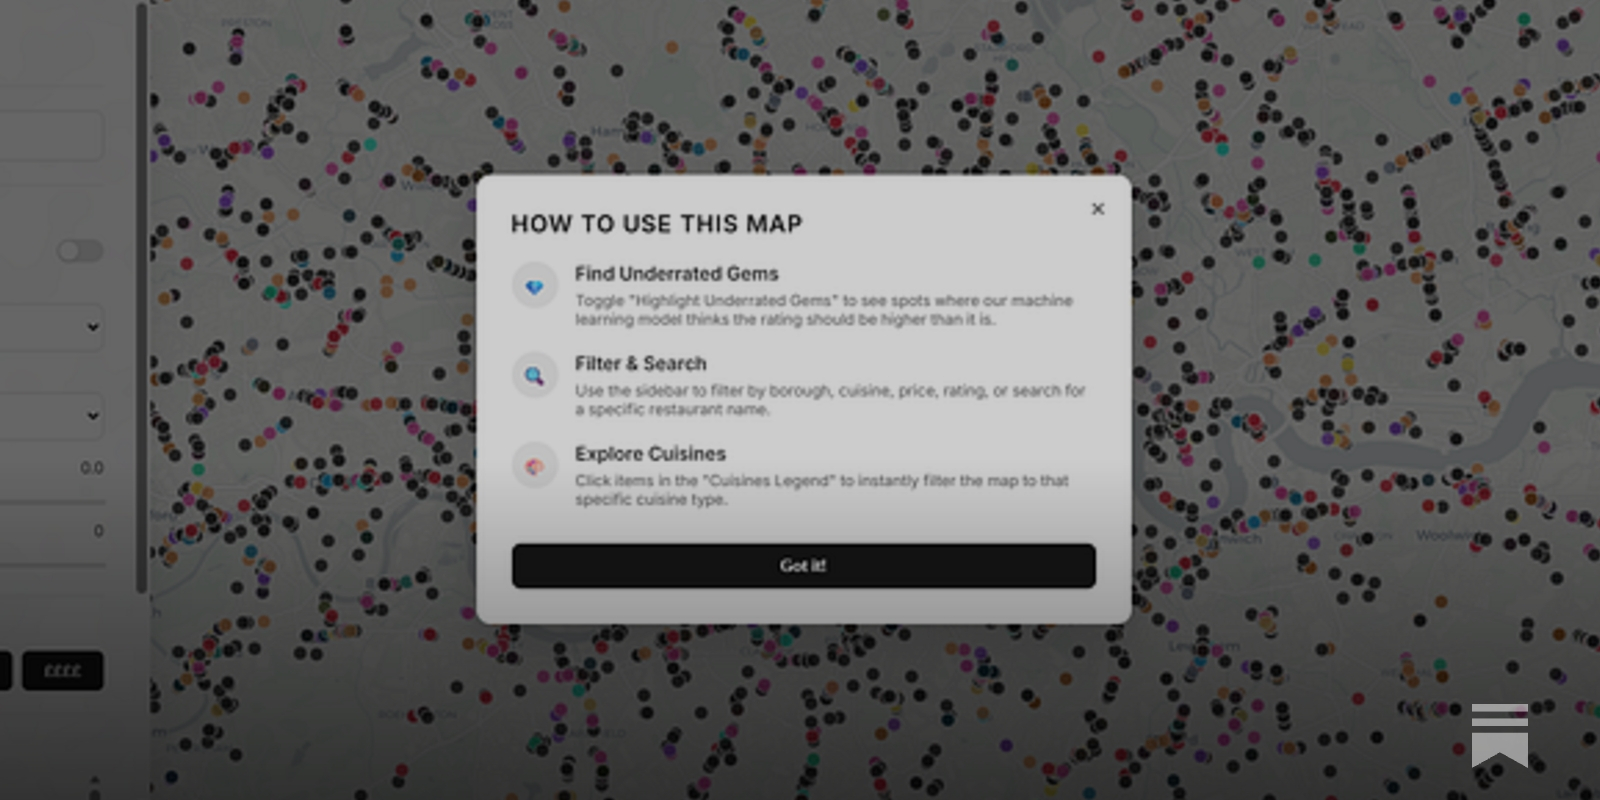
How Google Maps quietly allocates survival across London’s restaurants - and how I built a dashboard to see through it
I wanted a dinner recommendation and got a research agenda instead. Using 13000+ restaurants, I rebuild its ratings with machine learning and map how algorithmic visibility actually distributes power.
How Google Maps quietly allocates survival across London’s restaurants - and how I built a dashboard to see through it
I wanted a dinner recommendation and got a research agenda instead. Using 13000+ restaurants, I rebuild its ratings with machine learning and map how algorithmic visibility actually distributes power.
How Google Maps quietly allocates survival across London’s restaurants - and how I built a dashboard to see through it
I wanted a dinner recommendation and got a research agenda instead. Using 13000+ restaurants, I rebuild its ratings with machine learning and map how algorithmic visibility actually distributes power.
A Beginner’s Guide to Scientific Roadmapping
Wonderful maps and how to read them

A Map of the New Normal by Jeff Rubin | Penguin Random House Canada
NATIONAL BESTSELLER“A great read. I give [A Map of the New Normal] two thumbs up—way up.” —Policy MagazineBestselling economist Jeff Rubin warns that the spiraling inflation of the past few years is the front of a perfect storm of war, supply-chain disruption, geopolitical realignment, domestic upheaval, and energy scarcity that will change everything.

Cosmograph: Beautiful Visualization and Analytics | Cosmograph
Beautiful Visualization and Analytics

The Arctic Is in Dire Straits, 20 Years of Reporting Show
The Arctic has changed dramatically in the past 20 years, a new report shows, as temperatures skyrocket and ice rapidly melts
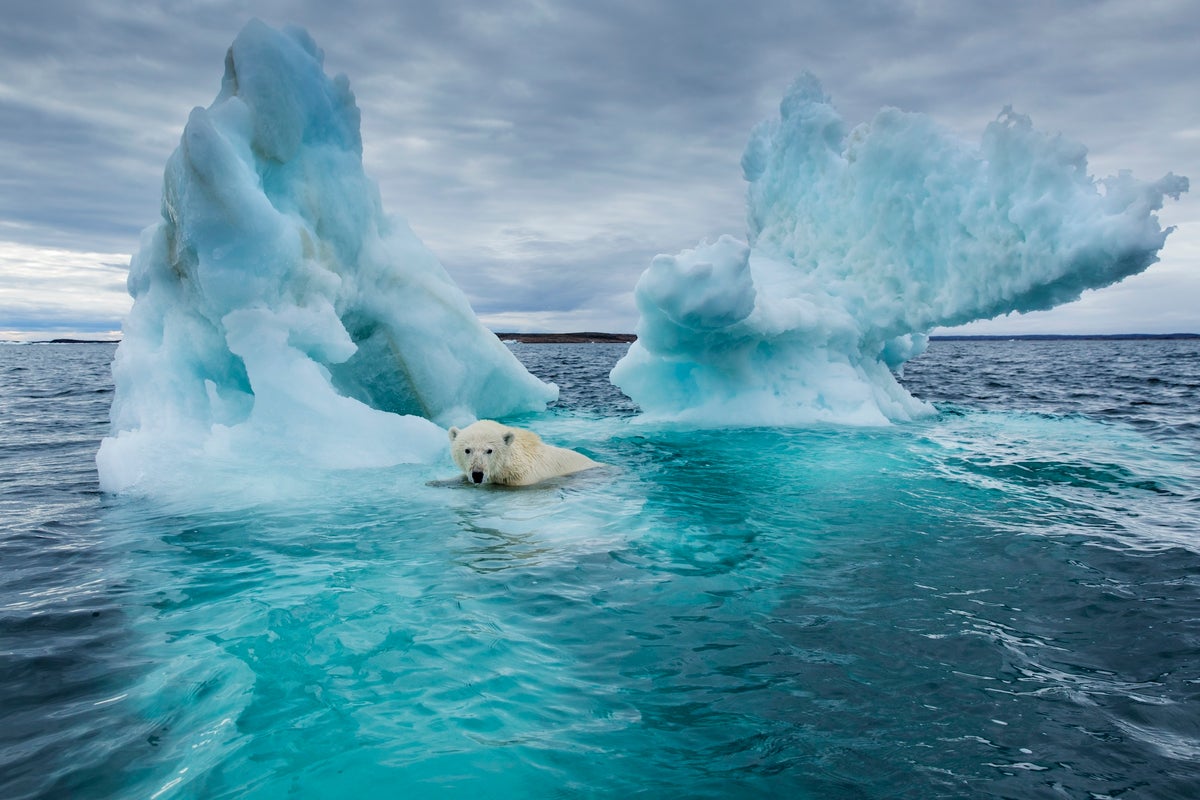
The Daily Planet #122: More on Deep Time - The Daily Planet
Chart Design Principles | Hands-On Data Visualization
Tell your story and show it with data, using free and easy-to-learn tools on the web. This introductory book teaches you how to design interactive charts and customized maps for your website, beginning with easy drag-and-drop tools, such as Google Sheets, Datawrapper, and Tableau Public. You will also gradually learn how to edit open-source code templates built with Chart.js, Highcharts, and Leaflet on GitHub. Follow along with the step-by-step tutorials, real-world examples, and online resources. This book is ideal for students, non-profit organizations, small business owners, local governments, journalists, academics, or anyone who wants to tell their story and show the data. No coding experience is required.
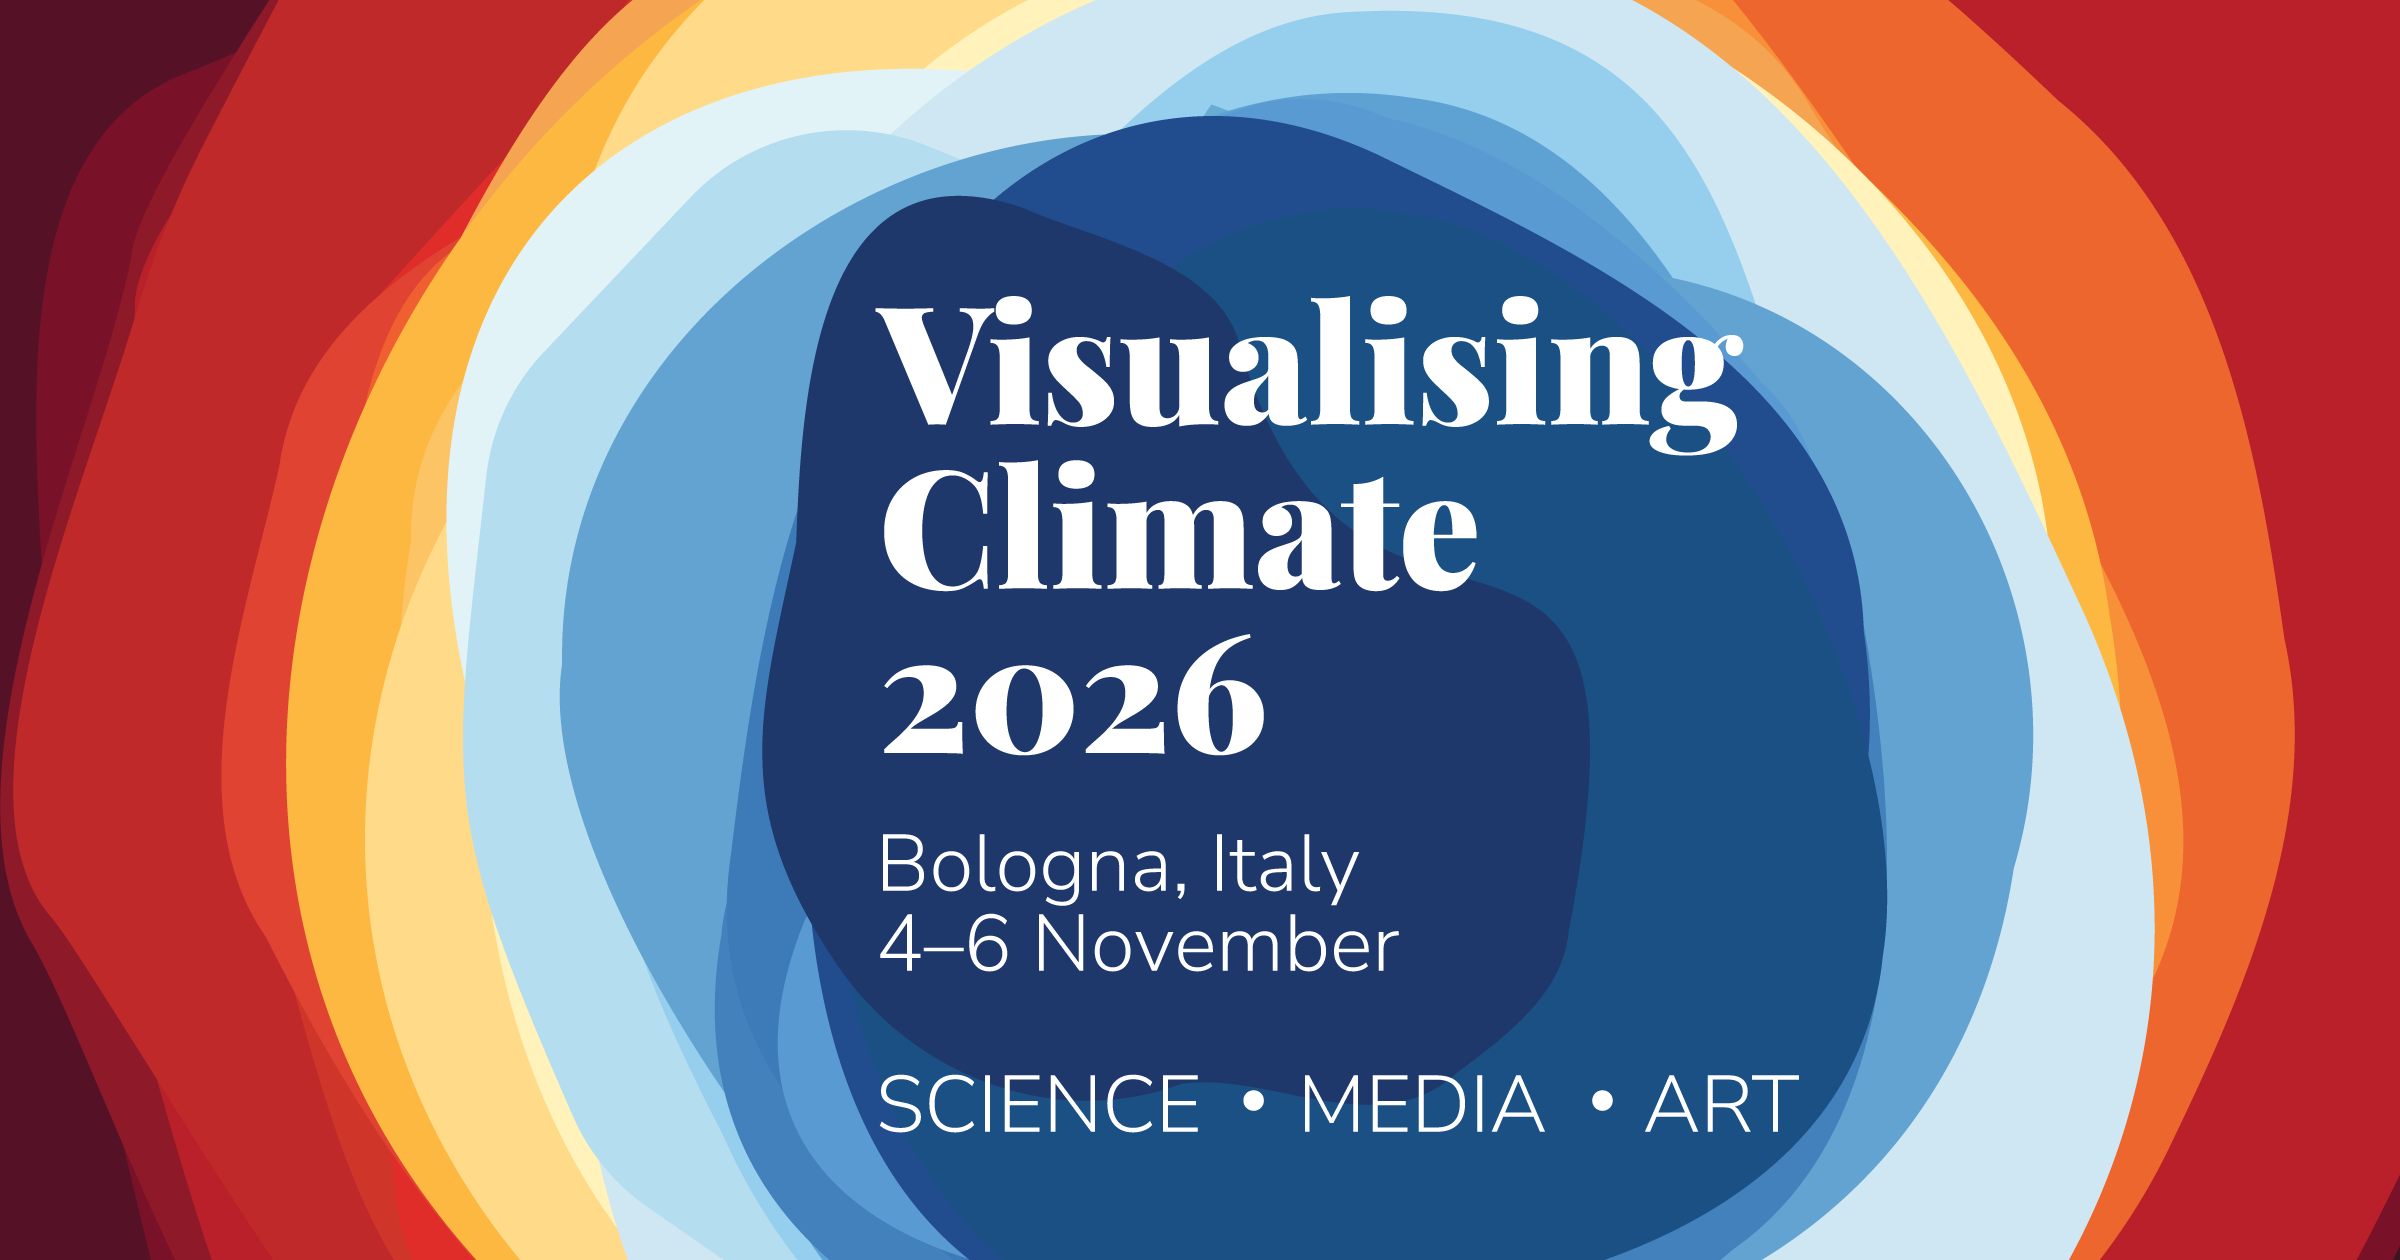
Visualising Climate 2026 — Conference
A global conference on climate data visualization, storytelling, and science. Bologna, Italy • 4–6 November 2026.
Decent Imaginaries
The digital sphere appears to be at an inflection point and we need to imagine what comes next as this era rots and burns. Imagining a renewed, decentralised world is difficult, but we can pull it off.