A cause-effect diagram is a visual tool designed to help you explore and identify possible causes for a problem or an observed phenomenon. This helps you to come up with possible root causes for the problem you observed, that you can then use to build experiments around.

WRKSHP.tools | Trend Canvas
The Trend Canvas helps you map different trends in the world around your business that may impact you in the future.
theknarf-experiments/flow-page
Contribute to theknarf-experiments/flow-page development by creating an account on GitHub.
Opportunity Solution Tree: A Visual Tool for Product Discovery
Learn how to use the Opportunity Solution Tree framework to create products customers crave and generate more revenue.
Regular exchange of issues between lab members to share research tasks
At the start of this project, we suggested that our graph-based "issue dashboards" would be used widely by members ...

theknarf-experiments/dep2
Contribute to theknarf-experiments/dep2 development by creating an account on GitHub.
Theory of Constraints - The Decision Lab
The theory of constraints is a systems-based methodology that identifies and addresses the weakest link in a process or system.

Impact Dashboard - Impact Counter | Impact Counter
Visualize the human impact of funding changes for aid and support organizations.

theknarf-experiments/flow-ts
Contribute to theknarf-experiments/flow-ts development by creating an account on GitHub.
Flowchart Maker & Online Diagram Software
Causal Inference Is Eating Machine Learning
Your most accurate model might be your most dangerous one.
GitHub - observablehq/plot: A concise API for exploratory data visualization implementing a layered grammar of graphics
A concise API for exploratory data visualization implementing a layered grammar of graphics - observablehq/plot
Visual Variables
Visual variables are “the differences in map elements as perceived by the human eye” (wiki.gis.com). No matter what the type of map, these are the fundamental ways in which graphic symbols can be distinguished.
Paradigma on Twitter / X
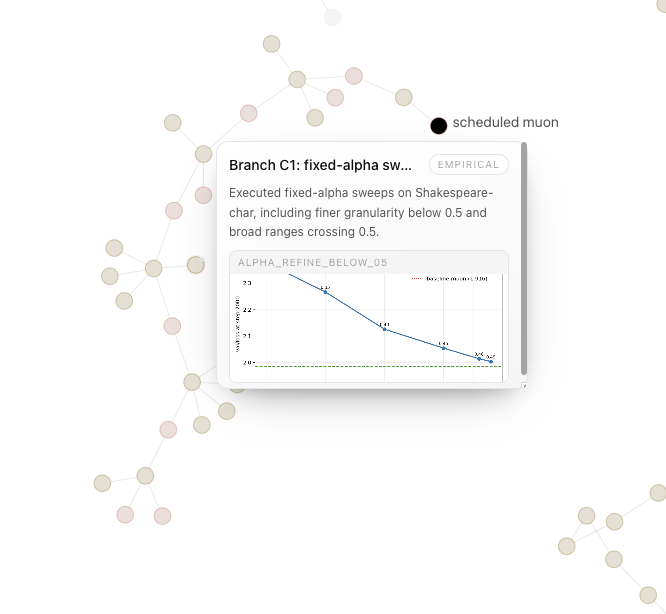
Flywheel views Directed Acyclic Graphs as the underlying data structure for research: nodes can be observations or experiments.When they're experiments, they contain an hypothesis and the artifact of the experiments that may reject it. In Flywheel, researchers can focus on… pic.twitter.com/DA1HtCzf3M— Paradigma (@paradigmainc) March 12, 2026
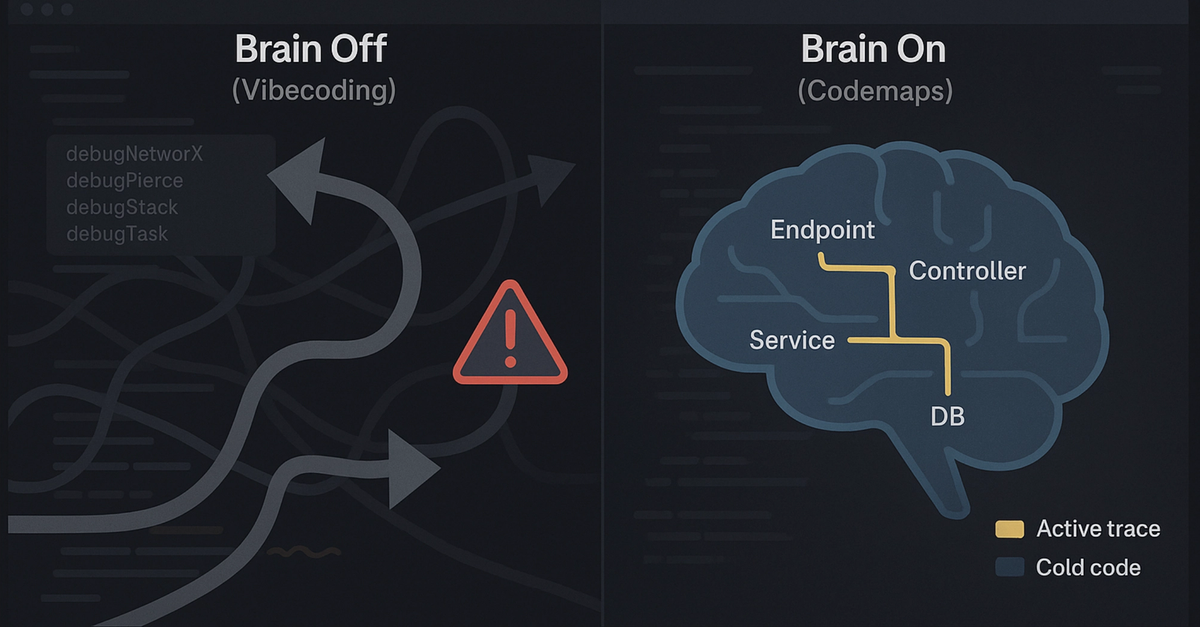
Windsurf Codemaps: Understand Code, Before You Vibe It | Cognition
Codemaps is meant to offer a shared understanding of a system between humans and AI, enabling your AI to teach you about the code you are looking at quickly and elegantly. A codemap can be generated about any system or snippet to illuminate its code paths, helping users learn and recall. Codemaps allows AI to be a partner that explains code in an accurate and consistent way, rather than generating tons of inscrutable slop.